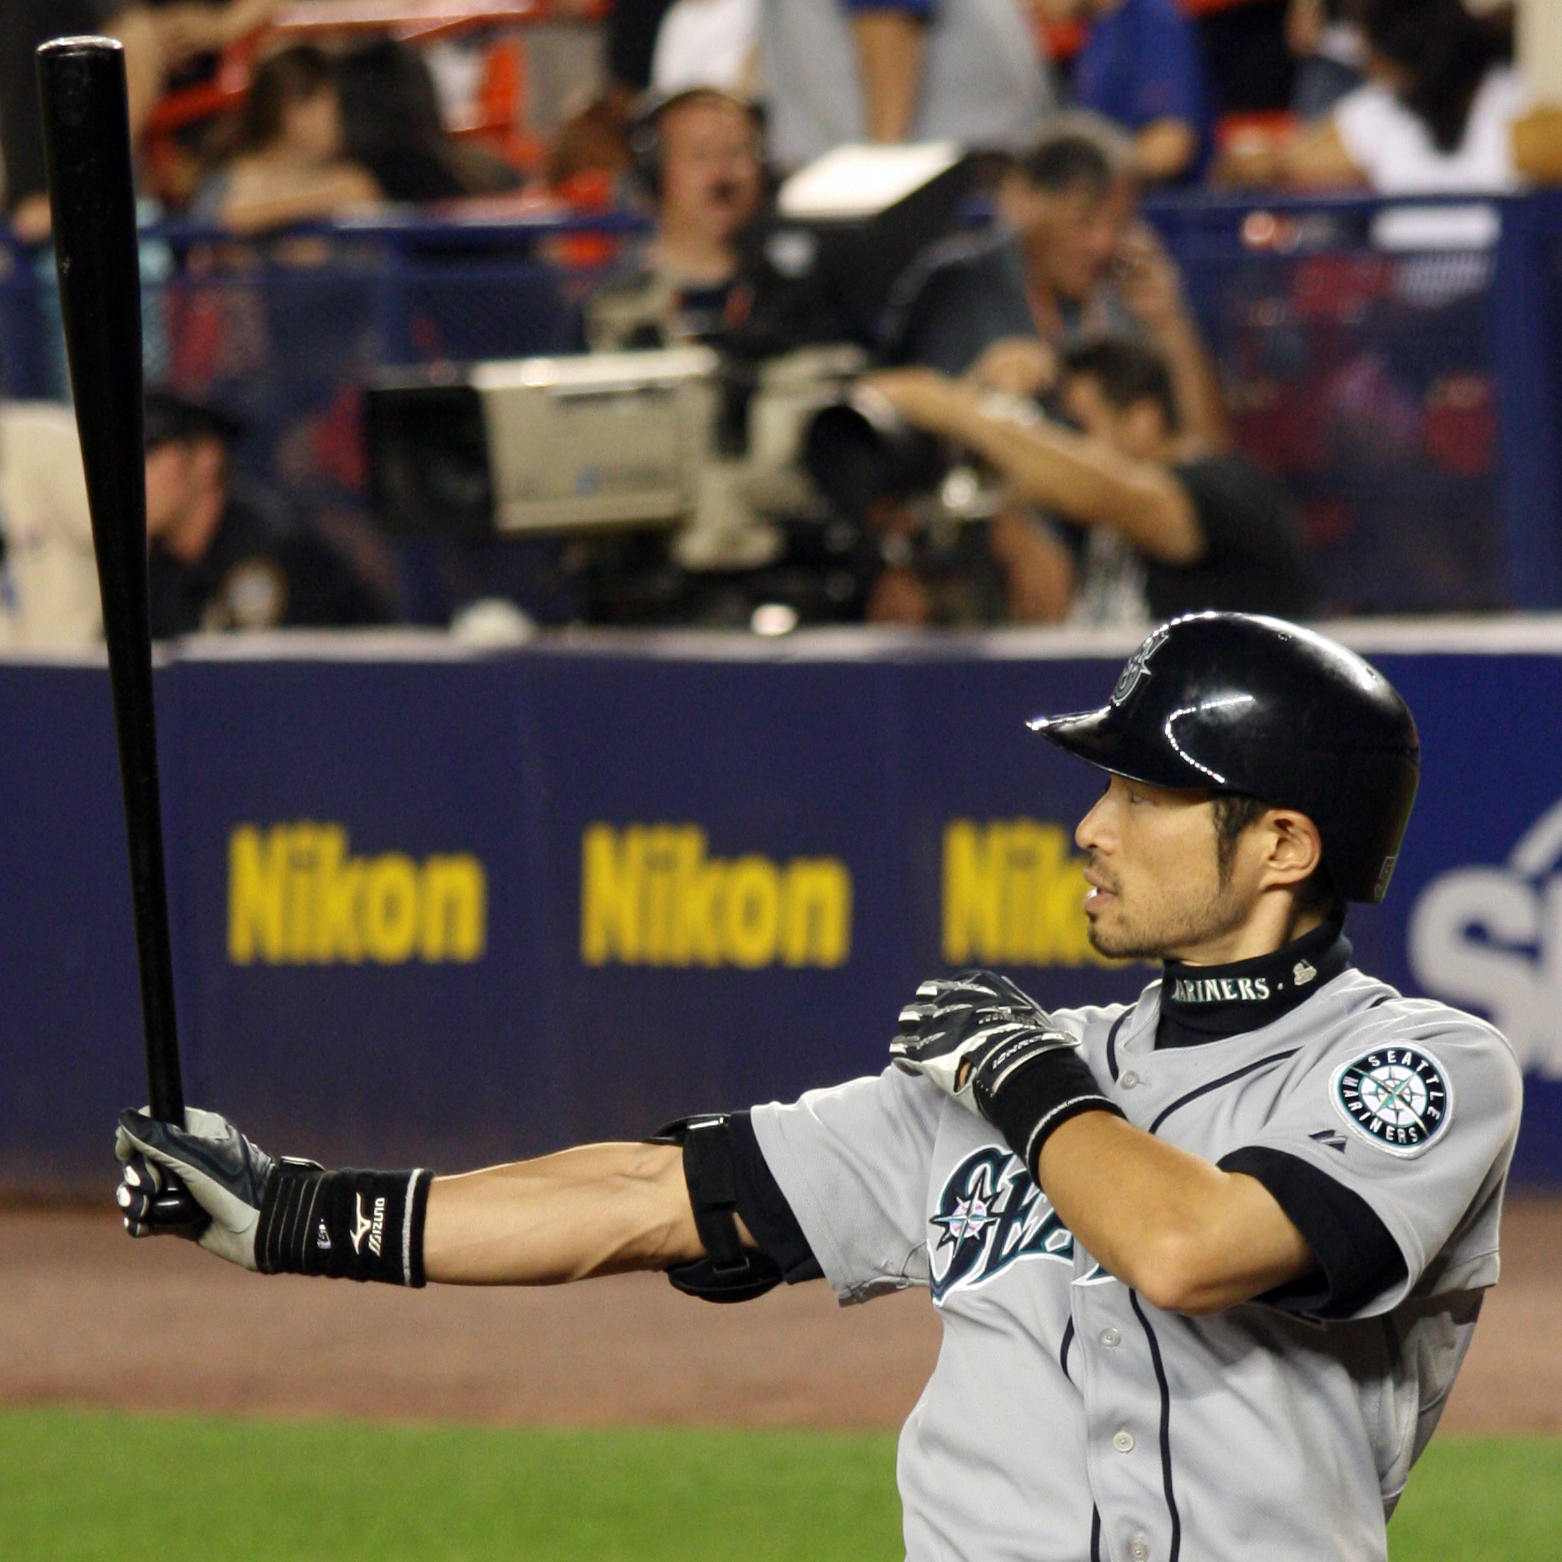
Saturday, October 30, 2010

Player Review/Prediction: Austin Jackson


Austin Jackson is the likely AL Rookie of the Year.  He put up some very good numbers:
.293 BA, .345 On Base Percentage, .400 Slugging Percentage and 27 stolen bases while having a reputation as a very good defensive centerfielder. 

All together, Jackson put up 2.5 Wins Above Replacement.  That was .4 WAR more than former Tiger CFer, Curtis Granderson managed with the Yankees.

Tiger fans must be thrilled to have such an exciting young player with the team and must be looking forward to a 2011 where this young player can only get better.

But, can he only get better?  Let’s take a closer look.

I have some MAJOR concerns with Jackson going forward.

The biggest concern is his strike out rate.  Jackson struck out 170 times last year while drawing only 43 non-intentional walks leading to a strikeout to walk ratio of almost 4 to 1.  Jackson struck out 27.5% of the time compared to a league average of 20.7%.  Players often struggle with the strike zone when they are young, and improve over time.  However, Jackson also had these strike out tendencies in the minors; striking out about 25% of the time at every level. 

There is a reason that Jackson’s strikeouts are so important.  If you don’t hit the ball, you’re almost always out.  If you do hit the ball, you at least have a chance to end up somewhere on the bases.  Jackson’s Batting Average on Balls In Play (BABIP) last year was .396.  BABIP measures a player’s batting average on hits that are not home runs.  An average player’s BABIP is usually around .300.  Though this can vary depending on the type of hitter.

Fly balls have very low BABIPs.   Most fly balls are caught by outfielders. 
Ground balls have higher BABIPs.  Some balls get past the infielders, and speedy players like Jackson can beat out some infield hits.
Line Drives have the highest BABIPs.  When a fielder catches a line drive, it is usually considered a good defensive play.

Batting average on:
Groundballs: Jackson=.318, League=.240
Flyballs: Jackson=.240, League=.140
Linedrives: Jackson=.748, League=.750

Can Jackson keep up a batting average on groundballs that is 32% better than league average?  Maybe, maybe not.  Ichiro Suzuki, who is renowned for his ability to get infield hits has a career average of .311 on ground balls.  Is Jackson better than Ichiro at beating out infield hits?  I’d be surprised to learn that he was.

Jackson’s batting average on fly balls is certain to come down.  His batting average on ground balls is likely to come down, though perhaps not that much.  His batting average on line drives is right in line with league average, so that should remain constant. 

Jackson was 3rd in baseball last year at hitting line drives, doing so over 24% of the time.  Is he that good of a hitter?  Considering his strikeout rate, I’d have to say doubtful.  It’s likely that some of those line drives next year become fly balls or groundballs, which turn into outs more often than not.


Best case scenario for Jackson:  He cuts down on his strikeouts leading to more balls in play.  He continues to hit line drives and ground balls and continues to post a high BABIP, more in the range of .375.  If this happens, expect Jackson to end up with a Batting Average/On Base/Slugging line of: .285/.340/.390.  Roughly the same as this year.  Not rea

Worst case scenario for Jackson:  Pitchers exploit his free swinging and his strike outs remain the same or increase.  While Jackson is putting less balls in play, his BABIP luck also runs out and the balls he does hit quit getting by infielders and dropping between outfielders.  If this happens, expect Jackson to end up with a Batting Average/On Base/Slugging line of:
.260/.315/.367.  Which would make him Melky Cabrera (.255/.317/.354) with a bit more speed.  Melky was recently released by the Atlanta Braves.

My prediction:  Somewhere in the middle.  I’ll give Jackson some benefit of the doubt and say he increases his walks (7.5%) and decreases his strikeouts (26%) slightly.  I think his BABIP will decrease to a still above average (.340) based on his GB/FB/LD rates (49%/31%/20% - I don’t think his LD rate this year was for real).  All this adds up to a line of: .260/.320/.370 in 2011.

A pretty significant offensive drop-off.  Jackson is still a valuable player though.  A good defensive centerfielder doesn’t have to hit much to help the team.  As a Dodger fan I’d be quite content with Jackson in CF for the next 5 years.  

Monday, October 25, 2010

Ichiro and Gwynn: A comparison

Some people mentioned Tony Gwynn in comparison to Ichiro.  I decided to take a look.


Walk rates are similar


Strike out rates.  Wow!  It's amazing just how good Gwynn was at getting the bat on the ball.


BABIP rates to be fluctuate, but both Gwynn and Ichiro have .350ish BABIPS.  Well above league average


According to Baseball-Reference Tony Gwynn:
hit ground balls 49.6% of the time with a.260 BABIP 
hit line drives 23.5% of the time with a .735 BABIP
hit fly balls 26.5% of the time with a .183 BABIP


The same numbers for Ichiro
ground balls: 55.4% .305 BABIP
line drives: 21.3% .708 BABIP
fly balls: 21.7% .162 BABIP


Career batting average/BABIP
Ichiro: .331/.357
Gwynn: .338/.341


Gwynn and Ichiro went about posting their high batting averages and high number of hits in similar, but not exactly the same way.


Both hitters limited strikeouts.  You can't have a high batting average with a lot of strike outs.  If you never strike out your potential batting average is 1.000.  If you always strike out your potential batting average is .000.  Easy enough to understand.


I've tried a few different ways to explain this, but I think an example will work best.  Let's consider 600 at bats for each player. 


First, deduct the amount of outs made on strike outs.
Ichiro K%=10.1 10.1% * 600 = 60.6 outs made by striking out.  539.4 at bats remain
Gwynn K%=4.7 4.7 * 600 = 28.2 outs made by striking out.  571.8 at bats remain


Hits on ground balls
Ichiro GB%=55.4  55.4 * 539.4 = 298.6 * .305 BABIP = 91.1 hits
Gwynn GB%=49.6  49.6 * 571.8 = 283.8 * .260 BABIP = 73.8 hits


Hits on fly balls
Ichiro FB%=21.7  21.7 * 539.4 = 117 * .162 BABIP = 18.9 hits
Gwynn FB%=26.4  26.4 * 571.8 = 151.2 * .183 BABIP = 27.7 hits


Hits on line drives
Ichiro LD%=21.3.  21.3 * 539.4=114.9 * .708 BABIP = 81.3 hits
Gwynn LD%=23.5  23.5 * 571.8=134.5 * .735 BABIP = 98.9 hits


Hits on bunts
Ichiro Bunt%=1.6%  1.6 * 539.4=8.9 * .660 BABIP = 5.9 hits
Gwynn Bunt%=.4%  .4*571.8=2.4 * .560 BABIP = 1.3 hits


Total hits
Ichiro = 91.1+18.9+81.3+5.9 = 197.3 hits
Gwynn = 73.8+27.7+98.9+1.3 = 201.6 hits


Batting Average
Ichiro = 197.3/600 = .328
Gwynn = 201.6/600 = .336


Gwynn got hits by never striking out 
Ichiro gets hits by rarely striking out, hitting a lot of ground balls, and being very fast
Both players avoided hitting fly balls which almost always find gloves waiting for them at the end of their flight.  

Sunday, October 24, 2010

Ichiro's Consistency

Hi, I love baseball, so I'll probably post a lot of baseball related stuff on here...


The Seattle Mariners' Ichiro Suzuki has been remarkably consistent in his 10 year MLB career as these graphs from Fangraphs.com will show.


Not a lot of variation in those green lines. There does seem to be a slight trending up in his strikeout rate the last three years, which could be worrisome, but, that trend is exaggerated by his low strikeout rate in 08. Strikeout rate is critical for batting average because batting average is dependent on balls in play. A strikeout is an out with no ball in play. Note the similarity between Ichiro's batting average and his BABIP graphs.


Look at how similar the graphs are.  Basically identical.  As Ichiro's BABIP  goes, so goes his batting average.


A graph of Ichiro's batted ball profile
Ground balls, fly balls, line drives.


Ichiro hits an insanely high amount of Ground balls, and an insanely low amount of fly balls compared to most hitters.


Average BABIPs for the the three types of batted balls are roughly:
Ground balls = .240, Fly Balls = .140, Line Drives = .750


Since ground balls have a higher BABIP than flyballs, Ichiro helps his batting average by avoiding fly balls in favor of ground balls.


Ichiro, also has an extremely high BABIP on groundballs-.311 for his career.  This is because he is extremely fast and gets an insane amount of infield hits by slapping the ball to the left side and outrunning the throw to first.


Notice 2004 in all of the above graphs.  2004 is the year that Ichiro hit .372 and broke the major league hits record by recording 262 hits. 
Ichiro's K rate was slightly lower than his norm, meaning he put more balls in play.  
Ichiro's BABIP was the highest of his career.  Ichiro put more balls in play, and more of them fell in for hits.
Ichiro's groundball rate spiked to over 60% and his flyball rate dipped to under 20%.  Almost unheard of numbers.  


Everything was perfect for Ichiro to get a ton of hits.  Low strike outs, lots of ground balls and few fly balls.


Is Ichiro starting to decline?  It's hard to see it. A slight uptick in strikeouts.  Line drives have been trending down since 2005 but nothing too apparent.  As long as Ichiro is fast he'll keep getting hits. He'll have to slow down (literally) eventually, but I'll be rooting for him to get to 3000.