Showing posts with label Zack Greinke. Show all posts

Friday, September 30, 2011

2011 Playoff Rotation Rankings


Texas' CJ Wilson will throw the first pitch (and at least the 2nd and 3rd as well (barring an injury)) of the 2011 MLB playoffs that start in just a few hours when the Rays take on the Rangers.

How he, and the other 32 (or so) starters, throw those pitches will go a long way in determining what team will walk off the field sometime around Halloween as World Series Champions.

Since starting pitching is so important in playoff series, I'm attempting to rank each playoff team's starting rotation.

What I've done is:
Find the average innings per start for each expected playoff starter.
Average FIP, xFIP, tERA and SIERA to find the number of runs each starter is expected to give up per 9 innings

Find the average number of innings per start for all the starters expected to make playoff starts.
Find the weighted average (weighted by innings) of the expected number of runs all starters are expected to give up per 9 innings.

Subtract each pitchers' expected number of runs from the weighted average to find each pitchers' runs saved compared to average (negative numbers indicate more runs saved).
Multiply each pitchers' expected number of runs saved by their average innings pitched divided by 9 to get the expected number of runs saved per start.

*Notes: National league pitchers were given a .25 runs per 9 penalty to account for differences between the leagues (DH, etc...)
The penalty for pitchers (Edwin Jackson) who pitched in both leagues was weighted by innings pitched in each league.
FIP, xFIP, tERA, SIERA data is from FanGraphs
Innings pitched and games started data is from Baseball-Reference
For pitchers who both started and relieved during the 2011 season, only their starting innings were used to calculate IP per start.  However, their FIP, xFIP, tERA and SIERA numbers from relief innings were included (except for Josh Collmenter, who is the only starter to pitch a significant number of relief innings.  I did not use his tERA or SIERA numbers at all.  Only FIP and xFIP from his starting innings).
For the Yankees, because their top 4 starters is a jumbled mess, I used the top 3 starters and 1/3 of each of Bartolo Colon, Phil Hughes and AJ Burnett.

Whew!

The results:
National League

*click to make bigger

Quelle suprise!  The Phillies' rotation is expected to be the best, by far, in the NL; giving up 1.34 runs less than the average playoff team.  Roy Halladay and Cliff Lee were the two best pitchers in the sample at -.73 and -.53 runs per start.  Zack Greinke was 3rd with -.52 runs per start.  

The DiamondBacks had the worst rotation with the starters expected to give up 1.72 runs more than the average group of starters.  

The other NL teams were below average as well.

In the

American League


The Tampa Rays have the best rotation; with a caveat.  I had no idea what to do with game 1 starter, Matt Moore.  Moore has started 1 game this season and he struck out 11 batters in 5 innings.  I averaged his season (9 innings) tERA and SIERA with his pre-season ZIPs projection.  This method gave him a .51 runs saved per 9 innings (a bit better than CC Sabathia).  I don't know how comfortable I am with this but there is some historical precedent for rookie pitchers faring well in the post-season. 

The Yankees' rotation fares worst with only Sabathia projecting to be better than average.  


Wednesday, May 4, 2011

Fili's GOD for May 4th 2011: Milwaukee Brewers at Atlanta Braves

Today's Game Of the Day is the first start of the season (and of the Milwaukee Brewers career) for Zack Greinke.  Greinke was traded, along with SS Yuneisky Betancourt, from Kansas City to Milwaukee this off season for a solid package of players including SS Alcides Escobar, Lorenzo Cain, Jake Odorizzi, and Jeremy Jeffress.

I wrote about Greinke here, when I didn't know he was going to pitch in the NL or miss the first month of the season.

Greinke suffered his injury playing pickup basketball so the injury wasn't pitching related.  There shouldn't be much reason to expect Greinke to pitch any worse than what we would have thought before the season, just that he'll pitch less.

Greinke made 3 minor league starts to gear up for tonight.  They looked like this:
High A: 1 start, 3 innings pitched, 10 batters faced, 1 hit, 0 walks, 4 strike outs.
AAA: 2 starts, 7.2 innings pitched, 33 batters faced, 10 hits, 1 home run, 2 walks, 9 strike outs.

Nothing there to indicate that he's not ready to go.

He'll be squaring off against Tim Hudson of the Braves.  Hudson came back last year after missing most of 2009.  He picked up right where he left off.

Hudson doesn't strike out a ton of hitters (6/9 innings career, but in the 5-5.5/9 innings range recently).  He doesn't walk anybody (2.75/9 innings career).  He gets a ton of ground balls (59% career, but well above 60% since his injury).

The Brewers offense-with guys like Prince Fielder, Ryan Braun, Corey Hart, and Ricky Weeks-is geared toward the home run.  Hudson's ground balls are geared toward preventing the home run.

It should be a good game between two pretty good teams, and two very good pitchers.


BONUS GOD
I'm also going to a AAA game tonight.

The Albuquerque Isotopes host the Omaha Storm Chasers.  Albuquerque is the AAA team for the (/my favorite team) LA Dodgers.  Omaha is the AAA team for Zack Greinke's former team, the KC Royals.  This is my first chance to see some of the Dodgers' top prospects, namely: Trayvon Robinson and Dee Gordon.

I most recently wrote about Robinson and Gordon here and Robinson and Gordon are both liking the Albuquerque air.

Robinson is off to a .365/.500 line.  Though the strike outs (29 in 96 plate appearances) are still a big problem.

Gordon is hitting .343/.340.  Not even Coors Field AAA can get him to hit for power.  He's stolen 11 bases though but has already committed 7 errors.

I'll also be hoping that Scott Elbert gets called on in relief.  Elbert has a fantastic arm as evidenced by 598 strikeouts in 516 career minor league innings as well as 29 K's in 26 major league innings.  Unfortunately, he walks about half that many.

I'm also excited to take a look at 4 top prospects for the Royals.  The Royals have the best farm system that's been put together in a while.

See John Sickels' Farm System Rankings

The first is Eric Hosmer.  Hosmer was rated as the #8 prospect in all of baseball by Baseball America.  He's currently obliterating minor league pitching to the tune of .518/.581.    The first baseman looks about ready for the bigs.  His career minor league OBP is just shy of .400 while his slugging is just shy of .500.  He walks a decent amount while drastically cutting his strikeouts last season.  He's ready to go and could be called up any day.

Next on the list (and Baseball America's prospect list at #9) is third baseman Mike Moustakas.  Moustakas isn't as far along as Hosmer is despite being a year older.  He can still hit the ball though.  He has a career .498 minor league slugging percentage.  He's struggled in AAA though.  In half of last year plus a month this year he's just hitting .308/.516 in AAA.  As evidenced by the OBP he doesn't walk as much as Hosmer but he avoids strikeouts while still hitting the ball a long way.  The defense at 3rd is shaky, but the Royals already have Hosmer and Billy Butler as 1B/DH's.  Moustakas will have to stick at 3rd to get playing time in KC.

Lorenzo Cain was a big part of the Greinke trade.  He's not nearly the hitter that Hosmer or Moustakas is.  He's more of a decent glove, decent bat center fielder.  He's put up a .365/.415 line in the minors.  In limited AAA time he's hit .363/.385 as well as .348/.415 in 43 big league games.

The starting pitcher tonight will be Mike Montgomery.  He's #19 on Baseball America's list.  Montgomery isn't your huge strikeout pitcher.  He's struck out about 8 batters per 9 inning in the minors. Montgomery seems to be able to limit home runs quite well; he gets well over 50% ground balls and has only given up 8 home runs in 272 minor league innings.  Montgomery is 1-1 with a 2.87 ERA this year and 3.87 FIP in 27 innings.  He's K'd 7.7/9 while walking an uncharacteristically high 5/9.

He'll be facing my doppelganger, Tim Redding.
**********************************************************************************


Wednesday, November 17, 2010

Player Review/Prediction: Zack Greinke


Zack Greinke was the 6th overall pick of the KC Royals in 2002 and was in the majors just 2 years later.  At the age of 20, he had an excellent season with an 8 – 11 3.97 season for the Royals.  His 2005 wasn’t nearly as good as he finished 5 – 17 5.80 but those numbers were exacerbated by a terrible BABIP and Left On Base Percentage. 

During spring training of 2006 Greinke left the team due to a diagnosis of Social Anxiety Disorder.  Greinke left baseball entirely for a few months and spent most of 2006 pitching in AAA. 

Greinke began 2007 in the Royals rotation and pitched well (3 – 6 3.80) in 14 starts before being moved into the bullpen. 

In 2008 Greinke returned to the Royals rotation and stayed there the entire season putting up a very good line of 13 – 10 3.47.

Then 2009 came.  Greinke didn’t give up an earned run in his first 4 starts and made 10 starts before giving up more than 2 runs.  He pitched complete games in 4 of his first 7 starts.  No one managed a home run against Greinke until June.  His excellence continued the entire season as Greinke ran away with the Cy Young finishing 16 – 8 with a 2.16 ERA. 

 Greinke couldn’t meet the lofty expectations created by his 2009, turning in a 10 – 14 record with a 4.17 ERA. 

So what happened in 2010, and what do we expect for 2011?

First, that’s sort of the wrong question.  The better question is, “what happened in 2009?”


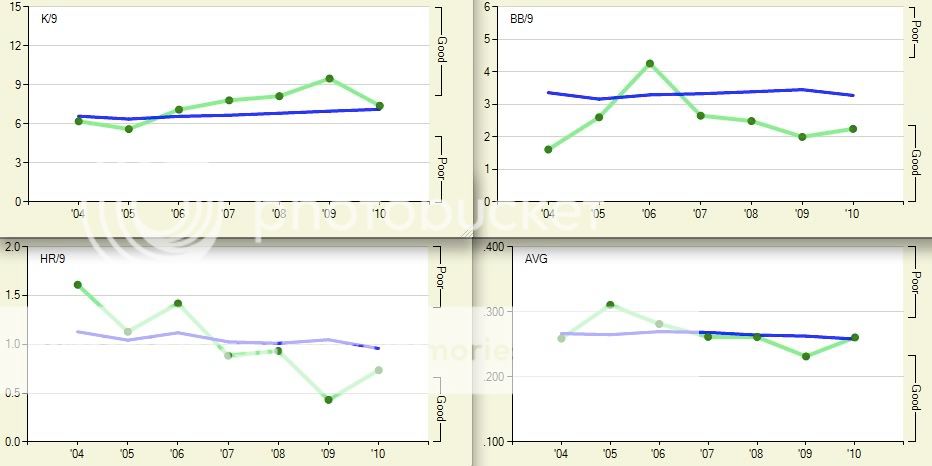
The previous graphs show that 2009 was the odd year for Greinke.  Strikeouts, walks, home runs, and batting average were all better than anything that he’d previously done in his career.  2009 isn’t the baseline we should use for Greinke.  2007 and 2008 are. 

How’d Greinke’s 2010 compare to his 2007 and 2008?  In terms of ERA, not good. 
Year: ERA, ERA+
2007: 3.47, 124
2008: 3.80, 126
2009: 2.16, 205 
2010: 4.17, 100
*ERA+ compares a pitcher’s ERA to league average and adjusts for home park.  100=average.  Above 100=better than average.  Below 100=below average.

At first glance, it would look like Greinke had a poor (for him) 2010.  But did he?
Looking back at the graphs of strikeouts, walks, home runs, and batting average, his 2010 looks very similar to his 2007 and 2008.  So, why the bad ERA in 2010?  The first place to look is always BABIP. 


Not that.  Greinke’s BABIP has been remarkably consistent since 2007.  The next place to look is Left On Base Percentage


Now, there we have something.  The percentage of runners that Greinke stranded in 2010 was well below his career level and well below the league average.  Simply put, opposing hitters were getting more ‘clutch’ hits against Greinke than would be expected. 

According to Baseball-Reference 
With runners in scoring position in 2010 opposing hitters hit .297
With men on base opposing hitters hit .275
With no runners on opposing hitters hit .249

There is no real reason to expect opposing hitters to hit better with runners in scoring position as they did in 2010 (opposing hitters in general do hit better with runners on base than they do with the bases empty).  Check out Greinke’s 2007 and 2008

2007 RISP .224, Men On .274
2008 RISP .234, Men On .268

In 2007 and 2008 Greinke got excellent results with runners in scoring position.  In 2010, of course, he did not.  Why?

2007 BABIP with runners in scoring position: .258
2008 BABIP with runners in scoring position: .295
2010 BABIP with runners in scoring position: .349

That stands out.  I’ve already mentioned that Greinke’s BABIP has been very stable.  So a more than 50 point jump between 2008 and 2010 seems to be nothing but bad luck in those situations.  And that number is likely to be closer to .300 in 2011-leading to less runs scoring and a lower ERA.

There is one concerning thing about Greinke, however.  Strikeouts.  Greinke’s K/9 in 2010 was well below his established norm and right around the league average. 


The following numbers are Greinke’s year-by-year percentages for pitches swung at and made contact with and swinging strike percentage. 

2007 78.3, 9.8
2008 79.5, 9.3
2009 77.7, 9.9
2010 82.8, 7.5

2010 looks a lot different.  Why?

Two obvious places to look are at Greinke’s pitch selection and his stuff.

Greinke’s pitch selection
2007 FB=66%, Slider=19%, Curve=8%, Change up=7%
2008 FB=62%, Slider=19%, Curve=12%, Change up=8%
2009 FB=59%, Slider=20%, Curve=14%, Change up=6%
2010 FB=61%, Slider=16%, Curve=11%, Change up=13%

Greinke is obviously using the change up more and his slider less.  This is strange because his slider has consistently been his best pitch and his change up his worst.  Also about half of Greinke’s fastballs in 2010 were classified as two-seam fastballs while less than 1% of his pitches the 3 previous seasons were so classified.

This chart shows Greinke’s runs saved per 100 pitches of each type for the last few years (high numbers are good. & negative numbers bad).

2007 Fastball = .57, Slider = .43, Curveball = 1.00, Change = -2.92
2008 Fastball = -.19, Slider = 2.49, Curveball = .14, Change = -1.53
2009 Fastball = 1.27, Slider = 2.90, Curveball = .50, Change = -1.21
2010 Fastball = .49, Slider = 2.34, Curveball = -1.91, Change = -.57

You can see that the slider is by far his most consistent pitch.  Why would he throw it less?  And why would it substitute his slider for his changeup, which is his worst pitch?  I don’t have any idea.  It’s worth noting that his change has been improving each year.  Also note that his curveball was an above average pitch for Greinke in 2007-2009 but was terrible for him this year.

I’m far from being an expert on Pitch F/X but I’ll look at the numbers quickly.


There’s no obvious decline in Greinke’s velocity


His curveball has shown a decrease in horizontal movement.  The decrease has been gradual which doesn’t explain why the decrease in effectiveness dropped off so quickly.

2007 8.1 inches
2008 7.5 inches
2009 6.1 inches
2010 4.5 inches

His slider has also shown a similar decrease in horizontal movement

2007 5.7 inches
2008 5.0 inches
2009 3.6 inches
2010 2.9 inches

So, what does it all mean?

First, Greinke v.2009 isn’t the Greinke we should be comparing to.  He pitched to the best of his capabilities and everything broke right for him.  We should be looking at Greinke’s 2007 and 2008 seasons as a baseline.

Greinke’s 2010 was a lot like his 2007 and 2008.  The only two differences were his left on base percentage, which should return to normal and his strike out rate.  Regarding his strikeout rate; he is pitching differently and his pitches are moving differently so does this strike out rate represent a new norm for Greinke?  I don’t know. 

For a projection I’ll say:
33 starts, 220 innings, 60ish walks, 190ish strike outs, and an ERA of 3.50 (give or take the standard half of a run).  So, basically, the same Zack Greinke we’ve seen since 2007-exluding his amazing 2009 and terrible LOB% in 2010.