Thursday, October 27, 2011

Hitter vs Pitcher match ups. They don't mean a thing.

The 2011 MLB Playoffs is coming to a close.  One, maybe two games remain.  Which team wins will come down to which team plays the smallest ball, gets the clutchest hits, and whose manager makes the shrewdest moves.

Inevitably, some of those moves will be based on hitter vs pitcher match ups.  We'll hear that Ian Kinsler is 0 for 8 in his career against Octavio Dotel.  So, we'll expect Dotel to face Kinsler in any high leverage situations late in games.  Should we expect Dotel to continue to retire Kinsler?  Should we expect Kinsler to go 0 for 9 against Dotel?  0 for 10?  0 for 20?  0 for 50?

This blog post was brought about by my reading this article by Tom Tango.   In the comments section there is a link to this article by Dan Fox.   Both articles are good reads and written by much smarter and better writers than I - so read them.

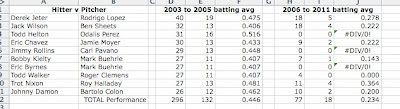
In the second article, Dan Fox posts a table with the most statistically significant batter owning pitcher match ups from 2003 to 2005.  These 10 batters combined to go 132 for 296 for a .446 batting average against their bitches the pitchers they faced.

If the narrative is true, that a hitter who hits .446 against a pitcher will be likely to continue to succeed against that pitcher, then we should be able to look back and see continued above average performance.  So, do we?


Uh...no.  The same hitter vs pitcher matchups resulted in an 18 for 77 performance from 2006 onwards.  That's a .234 batting average.  

Hitter vs pitcher match ups are just not statistically relevant sample sizes.  


Here are the links to the baseball-reference hitter vs pitcher match ups I looked up.


Monday, October 24, 2011

2012 ZiPS Projections

AL East
Yankees
Red Sox
Rays
Jays
Orioles

AL Central
Tigers
Indians
Royals
White Sox
Twins

AL West
Rangers
A's
Angels
Mariners

NL East
Phillies
Braves
Mets
Nationals
Marlins

NL Central
Brewers
Cardinals
Astros
Pirates
Cubs
Reds

NL West
Dodgers
Giants
Rockies
Padres
Diamondbacks

2011 Player Review/Prediction Review


2011 Player Review/Prediction Review


About a year ago I made predictions for a few major league players’ 2011 season.  The season is over and it’s time to see how I did.

***

The first player was Austin Jackson.  Jackson was coming off of a Rookie of the Year season with the Tigers. 

Jackson’s 2011 BABIP looked higher than he’d be able to sustain.   Jackson had hit line drives in 24% of the time in 2011.  I thought he’d be closer to 20% line drives and a BABIP of .340.

I was also concerned about his strikeout rate.  I thought he would walk a bit more ( 7.5%) in 2012 while striking out a bit less (26%).

 Overall, I predicted a .260/.320/.370 line in 2012 for Jackson. 

What’d he do?
He hit .250/.317/.374.  His BABIP was .340 with a line drive rate of 16%.  He increased his walk rate to 8.4% while his strikeouts also increased to 27%. 

***

The nextplayer was Clay Buchholz.  Buchholz was coming off of a tremendous season with Boston where he went 17 – 7 with a 2.33 ERA. 

Buchholz had an outstanding BABIP (.265) and LOB% (79) in 2010 that I contributed to his low ERA and, which, I didn’t think he’d be able to sustain.

My prediction for him was somewhat incomplete as I only predicted an ERA between 3.50 and 4.50.

Buchholz’ season was also incomplete.  He only managed 14 games and 83 innings before going on the DL in mid-June with a back injury. 

In those 83 innings he did about what we’d expect in terms of walks, strikeouts and home runs.  However, he did continue to post a low BABIP (.264) and high LOB% (79).  Still, his ERA was 3.48. 

***

The thirdplayer was Atlanta’s Nate McLouth.  McLouth’s 2010 was terrible.  After being a very productive hitter in 2008 and 2009 he completely fell apart. 

McLouth struck out a lot more in 2010 (20%) than over the rest of his career (17%).  I couldn’t find much reason for that to continue and expected his strike out rate to move back towards his career rate.

McLouth’s BABIP also took a nosedive.  His career rate was around .280 and his 2010 BABIP was just .220.   I thought that his 2011 BABIP would be a lot closer to .280 than .220. 

McLouth also showed a decrease in power.  He was hitting many more balls on the ground than in the air or as line drives.  That saps power. 

I predicted McLouth to come back somewhat in 2011.  I was pessimistic in saying he’d hit: .240/.330/.400.

What’d he do?
He did drop his strikeouts back down (16.2%).  His BABIP did go back up (.270).  His power remained nonexistent (.104 ISO).  He hit more balls on the ground, the least fly balls of his career and ended up with a .228/.344/.333 line. 

***


I predicted a .347/.401 season out of him based on a 22% LD rate, 6% walk rate and 13% K rate and .332 BABIP.

He had a 22% LD rate.  He walked a bit less than I anticipated (5.3%) and struck out much less (10.5%).  He came up a bit short of my projection though with a .315/.382 line. 

A large part of that was BABIP.  Despite having almost the exact batted ball profile that I predicted he only had a .298 BABIP.   A .634 BABIP on Line drives and .108 BABIP on fly balls are to blame. 

***

The next player reviewed was Zack Greinke

Greinke is best known for his amazing 2009 season where he won the Cy Young award with a 16 – 8 record and 2.16 ERA.

In my first post I suggested that that season represented a perfect storm of performance and luck for Zack and we shouldn’t expect that type of season going forward.   Greinke is more a very good pitcher than he is a Hall of Famer.  I stated that Greinke’s 2011 should look like his 2007, 2008, and 2010 seasons. 

Last November I predicted a 33 start, 220 inning, 60 walk, 190 strike out 3.50 ERA season for Zack.  That was before Greinke was traded to the weaker hitting NL and broke some ribs playing basketball.   

Greinke ended with 28 starts, 172 innings, 45 walks, 201 strike outs and a 3.83 ERA.

But Zack had one weird season. 

In May and June Greinke was striking out batters like a fiend (11.5/9 innings or 30% of batters faced).  He wasn’t walking anyone (1.7/9 innings or 4% of batters faced).  But he had an ERA north of 5. 

 This was unprecedented.  Here is a list of the 20 pitchers in baseball who had more than 10 K's per 9 while walking less than 2 per 9.  None of them had ERA's higher than 3.23.  

A .350 BABIP and Left On Base % in the mid 50's was the culprit.  That bad luck couldn't hold up, course, and Greinke ended the season with a much more respectable .318 BABIP and 70% LOB while continuing to strike out over a batter per inning and walk next to no one.  His unlucky May and June hurt his overall ERA but his defense (and luck) independent statistics show him as a pitcher who should have had an ERA closer to 3 than 4.  

***


Hill was coming off of a horrific 2010 where he hit only .271/.394 coming off of .330/.499 2009.  A lot of the poor 2010 was BABIP related.  He had a .196 BABIP in 2010.  There were problems though, 11% line drives being the biggest and a shift to hitting more fly balls. 

I speculated that the increase in fly balls could have been because of his 2009 season which featured a 15% HR/FB rate that led to 36 home runs.  Chicks dig the long ball so, perhaps, Hill was trying to hit more homeruns. 

I hoped he would up his line drive rate to 15% and cut out some fly outs.  I predicted a .255/.307/.411 line in 540 at bats with 26 doubles, 17 home runs, 38 walks, 76 strike outs and a .260 BABIP
He didn’t get there.  Hill ended up hitting .267/.299/.356 in 520 at bats with 27 doubles, 8 home runs, 35 walks and 72 strike outs with a .268 BABIP.

I basically nailed everything except the power. 

In my original post I noted that Hill had an up and down HR/FB rate.  Some seasons 3% of his fly balls ended up as home runs and other seasons five times as many left the yard.  This was a down year as only 4% of his fly balls ended up as home runs. 

Tuesday, October 18, 2011

Pitching Wins Championships: 2011 MLB playoffs

"Pitching wins championships"
That's the adage.  Or at least it has been the adage since the New York Yankees made Babe Ruth a full time pitcher back in 1920.

Let's see how the adage is holding up in the 2011 playoffs

8 teams, 4 from each league, made the post season.  Where did they rank in terms of pitching prowess?

Phillies #1 in NL
Brewers #4 in NL
Cardinals #7 in NL
DBacks #11 in NL

Yankees #4 in AL
Tigers #6 in AL
Rangers #7 in AL
Rays #8 in AL

I've ranked the teams in order of an average of FIP, tERA, and SIERA.  These are defense independent metrics.  I use defense independent metrics because I want to isolate how the pitchers did without considering a good or bad defense behind them.

Every team, except the Diamondbacks, were in the top half of their league.

How about offense?
Cardinals #1 in NL
Brewers #2 in NL
DBacks #5 in NL
Phillies #6 in NL

Rangers #2 in AL
Yankees #3 in AL
Tigers #4 in AL
Rays #5 in AL

I've ranked the teams by wRC+.  Again, every team ranked in the top half of the league.

You can see that the teams ranked a bit higher in hitting than pitching.  The lowest ranked hitting team was the #6 Phillies.  Half of the pitching teams ranked lower than #6.

Let's look at the individual matchups
Phillies (#1 Pitching, #6 Hitting) vs Cardinals (#1 Hitting, #7 Pitching)
Brewers (#4 Pitching, #2 Hitting) vs DBacks (#5 Hitting, #11 Pitching)
Yankees (#4 Pitching, #3 Hitting) vs Tigers (#4 Hitting, #6 Pitching)
Rangers (#7 Pitching, #2 Hitting) vs Rays (#5 Hitting, #8 Pitching)

The Cardinals' #1 offense bounced the Phillies' #1 pitching staff.
The Brewers had the advantage in both offense and pitching, and knocked the DBacks out.
The Tigers' inferior pitching and offense managed to send the Yankees home early (or right on time, depending)
The Rangers had the advantage in both offense and pitching, and sent the Rays back to Florida.

In the second round:
The Cardinals' #7 pitching and #1 hitting beat the Brewers' #4 pitching and #2 hitting
The Rangers' #7 pitching and #2 hitting beat the Tigers' #6 pitching and #4 hitting

The two teams in the World Series both had the 3rd best (or 2nd worst) pitching staffs among payoff teams while having the best offenses among playoff teams.

One of them will win the championship.

Probably the one that pitches better (or hits worse).

*All stats from FanGraphs
*Data does not take into account changes made during the season (Cardinals acquiring Edwin Jackson, etc)
*Copious amounts of sarcasm


Friday, September 30, 2011

2011 Playoff Rotation Rankings


Texas' CJ Wilson will throw the first pitch (and at least the 2nd and 3rd as well (barring an injury)) of the 2011 MLB playoffs that start in just a few hours when the Rays take on the Rangers.

How he, and the other 32 (or so) starters, throw those pitches will go a long way in determining what team will walk off the field sometime around Halloween as World Series Champions.

Since starting pitching is so important in playoff series, I'm attempting to rank each playoff team's starting rotation.

What I've done is:
Find the average innings per start for each expected playoff starter.
Average FIP, xFIP, tERA and SIERA to find the number of runs each starter is expected to give up per 9 innings

Find the average number of innings per start for all the starters expected to make playoff starts.
Find the weighted average (weighted by innings) of the expected number of runs all starters are expected to give up per 9 innings.

Subtract each pitchers' expected number of runs from the weighted average to find each pitchers' runs saved compared to average (negative numbers indicate more runs saved).
Multiply each pitchers' expected number of runs saved by their average innings pitched divided by 9 to get the expected number of runs saved per start.

*Notes: National league pitchers were given a .25 runs per 9 penalty to account for differences between the leagues (DH, etc...)
The penalty for pitchers (Edwin Jackson) who pitched in both leagues was weighted by innings pitched in each league.
FIP, xFIP, tERA, SIERA data is from FanGraphs
Innings pitched and games started data is from Baseball-Reference
For pitchers who both started and relieved during the 2011 season, only their starting innings were used to calculate IP per start.  However, their FIP, xFIP, tERA and SIERA numbers from relief innings were included (except for Josh Collmenter, who is the only starter to pitch a significant number of relief innings.  I did not use his tERA or SIERA numbers at all.  Only FIP and xFIP from his starting innings).
For the Yankees, because their top 4 starters is a jumbled mess, I used the top 3 starters and 1/3 of each of Bartolo Colon, Phil Hughes and AJ Burnett.

Whew!

The results:
National League

*click to make bigger

Quelle suprise!  The Phillies' rotation is expected to be the best, by far, in the NL; giving up 1.34 runs less than the average playoff team.  Roy Halladay and Cliff Lee were the two best pitchers in the sample at -.73 and -.53 runs per start.  Zack Greinke was 3rd with -.52 runs per start.  

The DiamondBacks had the worst rotation with the starters expected to give up 1.72 runs more than the average group of starters.  

The other NL teams were below average as well.

In the

American League


The Tampa Rays have the best rotation; with a caveat.  I had no idea what to do with game 1 starter, Matt Moore.  Moore has started 1 game this season and he struck out 11 batters in 5 innings.  I averaged his season (9 innings) tERA and SIERA with his pre-season ZIPs projection.  This method gave him a .51 runs saved per 9 innings (a bit better than CC Sabathia).  I don't know how comfortable I am with this but there is some historical precedent for rookie pitchers faring well in the post-season. 

The Yankees' rotation fares worst with only Sabathia projecting to be better than average.  


Wednesday, September 28, 2011

Why Baseball is F’n Awesome! 2011 Final day AL Edition


Final day of the season.  Boston Red Sox and Tampa Rays tied for the final playoff spot.  A win for either team will continue their season.  

Dustin Pedroia singles and homers to give the Red Sox a 3 – 2 lead.

At the same time the Yankees were pummeling the Rays 7 – 0

Then the rains came in Boston; delaying the game

We have to assume that the Red Sox players were A) feeling somewhat confident with a lead and the Rays looking like they would be beat and B) watching the Yankees/Rays as the Rays began to come back.  

Then, with the Rays down to their last strike, Dan Johnson, hitting .103 on the season, does this

Game tied.  Going to extra innings. 

The Red Sox and Orioles remain scoreless as:

In Tampa the  Yankees get the first two batters on base in the top of the 12th.  With the score tied, nobody out, and runners at first and third the Yankees have a 82% chance of winning the game when an outstanding defensive play by Rays’ star Evan Longoria erases the Yankees' runner at 3rd and doubles the Rays’ chance of winning to 42%.   A strikeout and groundout leave the game tied in the bottom of the ninth.

In Boston, Jonathan Papelbon retires the first two batters that he faces in the ninth.  With a 3-2 lead and only one out remaining, Boston has a 95% chance of winning the game. 

Chris Davis hits Papelbon’s first pitch for a double.  Boston still has an 86% chance of winning the game.  Papelbon throws 2 balls, then Nolan Reimold swings and misses at two fastballs.  Boston is one strike away from winning when Reimold hits a ground rule double over the right centerfield fence.  

3 – 3 game. 

One ball and one strike later Robert Andino comes to bat

Red Sox have to root for the Yankees to beat the Rays so Boston and Tampa can play one game tomorrow for the playoff spot.  If Tampa wins Boston goes home. 

Bottom of the 12th in Tampa. 

After an Upton strike out, Evan Longoria who's already homered and saved a run with his glove comes up to bat.  


What does collapse look like in graph form?


And from the other perspective


Baseball is F’n Awesome!!!!

Friday, September 23, 2011

Matt Moore-iarty: The next big thing?

http://www.abqjournal.com/sports/2011/08/06/moore-is-minor-phenomenon.html/d01_jd_06aug_moore1_cmyk

Moriarty's Matt Moore mad his first major league start yesterday.  By all accounts it was a successful one.

Moore pitched 5 innings, facing 20 batters.  11 of those 20 batters (55%) struck out.  1 managed a walk.  4 had base hits.  0 scored.

Watch for yourself.
Highlights and Other Notes:
16: Derek "Captain Clutch" Jeter strikes out on a 96 mph fast ball to begin the game
24: Derek "The Captain" Jeter reflects upon his recent contract and the prospect of facing Moore for the next two seasons
30: Mark Teixiera can't decide what to do with an 86 mph change up.  So he takes it down the middle for strike 3.
Next 40 seconds: various New York Yankees flail haplessly at a variety of offerings from Moore.
1:10 Greg Golson strikes out on a wicked breaking ball
1:21 Derek Jeter strikes out again
1:55 Moore's last K of the night.  93 MPH fastball that Eduardo Nunez isn't particularly close to.  

Obviously, the 11 strikeouts and 1 walk are the most impressive numbers.  The early concern about Moore was his walk rate.  In 2009, in A-ball, he walked over 5 per 9 innings; 13% of all batters faced.  He's improved since then and showed very good control in this start.  But the strikeouts are what people will focus on.  Moore will not continue to strike out half of the batters he faced.  Zack Greinke leads all major league starters in K% and he's at 28%.  Doubtful that Moore is two times as good as the best major leaguer.  There is every reason to think Moore will continue to send major leaguers back to the dugout empty-handed, though.

In his minor league career (500 innings) he's struck out about 30% of the batters that he's faced.
The Yankees swung and missed at 18% of Moore's pitches.  The major league average is about 8%.

Why so many swinging strikes and strike outs?

Changing Speeds

A 10 mile per hour difference from one pitch the the next is significant.  Something about disrupting a hitter's timing.

Movement

Three distinct grouping of pitches.

In the upper right-hand corner are the fastballs.  Between 92 and 98 miles per hour with 7 to 14 inches of horizontal movement (moving towards left-handed batters).

Below those are his changeups.  Ten miles per hour slower than the fastball, but with the same type of horizontal movement.

To the left of those are the sliders.  82 to 84 miles per hour and breaking 0 to 5 inches in the opposite direction.

A batter has a bout 2 tenths of a second to decide whether to swing and where to swing.  In two tenths of a second a batter facing Moore has to decide if the pitch is coming at 98 miles per hour or 82 miles per hour.  Is it going to break towards him 2 feet or away from him 2 inches?


Matt Moore is going to be good.  He already is.


*Data from FanGraphs and BrooksBaseball.