Wednesday, November 24, 2010

Player Review/Prediction: Aaron Hill


Aaron Hill


Aaron Hill had a terrible 2010: 205/.271/.394 (BA/OBP/SLG) which led to 1.1 WAR almost all based on defense and position.  His offensive ‘contribution’ was 14 runs below replacement level.

This was especially disappointing considering his 2009: .286/.330/.499 which led to 3.9 WAR and 18 runs above replacement level on offense.  All told that was a swing of 32 runs offensively.

What happened?

You should know what we’re going to look at by now.


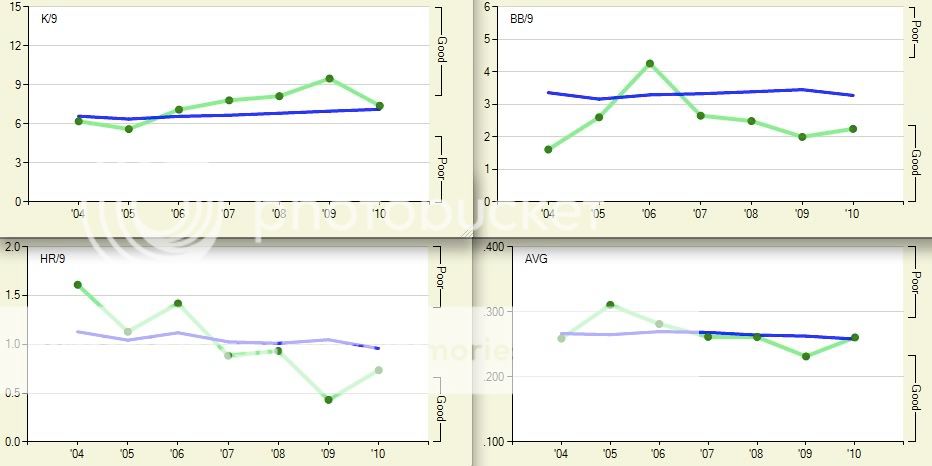
Walk and strike out rates didn’t change much


His power remained above average


BABIP fell off of a cliff
He went from being a guy with an average or better BABIP to the lowest BABIP in the majors among qualified players.  So there we go.  Expect a full bounce back from Hill next season as luck corrects itself.  If only it were that easy.


There is a huge change in Hill’s batted ball profile in 2010. 
His ground ball rate is around where it has been.  
But his fly ball rate soared upwards while his line drive rate cratered. 

We know that line drives have the highest BABIPs (.750ish) and fly balls have the lowest (.140) so we’d fully expect his BABIP to to decrease.

Using the major league average BABIPs on Hill’s batted ball profile we get that he should have been expected to have had a BABIP of .240.  His actual BABIP was .196.  If Hill had had a BABIP of .240, he would have had 24 more hits.  If all of those hits were singles, his line for 2010 would have looked like: .251/.305/.440, a heck of a lot better. 

Do Hill’s BABIPs usually follow league average?
For his career:
Ground Ball BABIP = .241 – YEP
Fly Ball BABIP = .136 – YEP
Line Drive BABIP = .706 – Not quite.

If we give Hill a BABIP consistent with his career averages we come up with a BABIP of .234 which gives Hill and extra 22 hits and a line of: .246/.300/.435.  Still much better than his actual 2010.

But .245/.300/.435 is still way off from his .270/.325/.427 career numbers and we still don’t know what’s going on with the lack of line drives and increase in fly balls.

In 2009 Hill hit 36 home runs, that’s more than double how many he hit in his 4 previous seasons combined.  We know how the Blue Jays have emphasized hitting for power (see Bautista, Jose for Exhibit A) the last couple of years.  Have the Blue Jays encouraged Hill to try and hit more fly balls in order to get more home runs?  I don’t know.  He hit 36 in 2009 without resorting to hitting more than half of his balls in the air.  In 2009 Hill also had a HR/FB rate of 14.9% compared to a career rate of 8.6%.

Year HR/FB, Isolated Power
2010 10.8%, .189
2009 14.9%, .213
2008 2.4%, .098
2007 8.6%, .168
2006 3.6%, .095
2005 2.6%, .111

Hill’s HR/FB and ISO are all over the map.  League average ISO tends to be around .150 and HR/FB around 10%.  Some years Hill is well above average, and some he is well below.  So, who is the real Aaron Hill?

I don’t really know.  His walk and strike out rates seem to be established but his power numbers are all over the place and the sudden change in batted balls is just weird.

Batted ball rates stabilize over a relatively small number of plate appearances (well below the 580 Hill received last year) so it’s unlikely that his increase in fly balls was a fluke and much more likely that it was something conscious in his plate approach.  It sure seems to be a bad plate approach though.  Aaron Hill is 5’11” and 200 lbs (about the same size that I am).  He’s not a hulking slugger who should be trying to launch every shot into the seats.   I’d hope that the Blue Jays see this and try to get him to hit less fly balls.

I’m not encouraged by Hill’s month-to-month batted ball data
Month FB%
April 51.7%
May 48.9%
June 56.7%
July 51.4%
August 61.7%
Sept/Oct 53.6%

Doesn’t appear that they tried to get him to alter his swing during the season at all as he hit more fly balls the second half of the season, than he did the first.

So, what do I make of it?

Official Prediction:
.255 batting average, 540 AB, 26 doubles, 17 home runs, 38 walks, 76 strike outs, .260 BABIP, .307 OBP and .411 SLG

That’s splitting the difference in his FB rate between his career and 2010 and coming up with 48% fly balls and 15% line drives.

If he keeps hitting fly balls like he did in 2010 the batting average and On Base Percentage will come down with a few more home runs.

If he returns to his 2006-2009 batted ball rates then expect the average and On Base Percentage to come up and a drop in home runs.

Tuesday, November 23, 2010

Day Planners: November 23rd

1999
Class in the morning
Some stuff that is crossed out-guess that I accomplished it
Come out take a shower
Go see Suicidal Tendencies at the Launch Pad

2000
Was Thanksgiving.  Probably ate Turkey


2001
Play basketball in the morning
Wash my car in the afternoon

2002
Picked up a shift at work from 9:30 to 12:30.  This required me to drive to Las Lunas
Stop by my office to:
     See Val
     Give in some paperwork
     Get some paperwork
Sometime during the day I had to:
     Call UNM about my schedule
     Pick up and drop off some books at the Library

2009
Use my next to last clip on my ten times gym card

Thursday, November 18, 2010

Day Planners: November 18th

1999
Had an accounting test in the morning.  First class.
I was then going to hit the UNM gym bookended by some studying.
After finish my classes for the day I was going to go and see my grandmother in the hospital.
That night Type-O Negative was playing at the Sunshine Theater.  I don't think I went

2000
Went to work
Went to the Bank on the way home

2001
Took a Sunday off

2002
Made smoothies from 7 to 3
Went to the gym to do Cardio
That night I was either going to:
Hang out with Vicki
Go see Tool
Or call "Terra"
--your guess is as good as mine what I did.  I have have seen Tool a few times, so maybe that.

2004
Get up and go for a swim
Meet a new community membership client-turned out to be a really awesome guy
"Buy Phil Tix" ???
Fix the window on my Jeep
Buy a heater for my bed

2008
Living in Sweden
Jog to the gym and work out "legs"
Go to ICA and buy groceries and some stuff to clean the drain
Clean the drain
Hit the sauna at 7:30

2009
Living in Sweden
Had to buy groceries
Shave and clean the bathroom

2010 AL Cy Young: Pitcher Wins

The Baseball Writers Association of America (BBWAA) will announce the 2010 AL Cy Young in about 10 minutes (as of this posting)

The two main contenders would figure to be:

CC Sabathia of the NY Yankees: 21 - 7  3.18 34 starts, 237.2 innings, 74 walks, 197 strikeouts
Felix Hernandez of the Seattle Mariners: 13 - 12 2.27 34 starts, 249.2 innings, 70 walks, 232 strikeouts

Every SABR stat in the world says that Hernandez should win easily over Sabathia (who might not even be the 2nd best pitcher in the AL this year).

But the BBWAA hasn't always been receptive to sabermetric ideas.  One of the most galvanizing statistics is pitcher wins.  Traditional wisdom says that the pitcher with the most wins must be better-he has more wins.  Wins of course don't really reflect how a pitcher pitched as much as it reflects how the pitcher pitched, how the other pitcher pitched, how the team hit, how the other team hit, how the team fielded, how the other team fielded and a good dose of luck.  But some people still cling to pitcher wins despite well thought out articles like this one.
http://joeposnanski.si.com/2010/09/10/king-felix-vs-c-c/

Just for fun I'm going to take a quick look at pitcher wins in this case and still show that Felix was the better pitcher this year.

Felix won 13 games this year, while losing 12-a 52% winning percentage
Sabathia won 21 games this year, while losing just 7-a 75% winning percentage

How can Felix be better?
The Seattle Mariners won 61 games this year while losing 101-a 38% winning percentage
The New York Yankees won 95 games this year while losing 67-59% winning percentage

Clearly the Yankees were a better team.

If we take out Felix's wins and losses the Mariners won 48 games while losing 89 games-a 35% winning percentage
If we take out CC's wins and losses the Yankees won 74 games while losing 60 games-a 55% winning percentage.

Dividing Felix's winning percentage (52%) by the Mariners' winning percentage (35%) without Hernandez we get a ratio of 1.48.  Felix won games 48% more often than the team as a whole.

Dividing CC's winning percentage (75%) by the Yankees' winning percentage (55%) without Sabathia we get a ratio of 1.36.  CC won games 36% more often than the team as a whole.

Looking at it this way Felix Hernandez had a higher winning percentage than Sabathia.

If anyone besides Felix Hernandez walks away with the AL Cy Young today the BBWAA writers aren't properly valuing wins.

Wednesday, November 17, 2010

Player Review/Prediction: Zack Greinke


Zack Greinke was the 6th overall pick of the KC Royals in 2002 and was in the majors just 2 years later.  At the age of 20, he had an excellent season with an 8 – 11 3.97 season for the Royals.  His 2005 wasn’t nearly as good as he finished 5 – 17 5.80 but those numbers were exacerbated by a terrible BABIP and Left On Base Percentage. 

During spring training of 2006 Greinke left the team due to a diagnosis of Social Anxiety Disorder.  Greinke left baseball entirely for a few months and spent most of 2006 pitching in AAA. 

Greinke began 2007 in the Royals rotation and pitched well (3 – 6 3.80) in 14 starts before being moved into the bullpen. 

In 2008 Greinke returned to the Royals rotation and stayed there the entire season putting up a very good line of 13 – 10 3.47.

Then 2009 came.  Greinke didn’t give up an earned run in his first 4 starts and made 10 starts before giving up more than 2 runs.  He pitched complete games in 4 of his first 7 starts.  No one managed a home run against Greinke until June.  His excellence continued the entire season as Greinke ran away with the Cy Young finishing 16 – 8 with a 2.16 ERA. 

 Greinke couldn’t meet the lofty expectations created by his 2009, turning in a 10 – 14 record with a 4.17 ERA. 

So what happened in 2010, and what do we expect for 2011?

First, that’s sort of the wrong question.  The better question is, “what happened in 2009?”


The previous graphs show that 2009 was the odd year for Greinke.  Strikeouts, walks, home runs, and batting average were all better than anything that he’d previously done in his career.  2009 isn’t the baseline we should use for Greinke.  2007 and 2008 are. 

How’d Greinke’s 2010 compare to his 2007 and 2008?  In terms of ERA, not good. 
Year: ERA, ERA+
2007: 3.47, 124
2008: 3.80, 126
2009: 2.16, 205 
2010: 4.17, 100
*ERA+ compares a pitcher’s ERA to league average and adjusts for home park.  100=average.  Above 100=better than average.  Below 100=below average.

At first glance, it would look like Greinke had a poor (for him) 2010.  But did he?
Looking back at the graphs of strikeouts, walks, home runs, and batting average, his 2010 looks very similar to his 2007 and 2008.  So, why the bad ERA in 2010?  The first place to look is always BABIP. 


Not that.  Greinke’s BABIP has been remarkably consistent since 2007.  The next place to look is Left On Base Percentage


Now, there we have something.  The percentage of runners that Greinke stranded in 2010 was well below his career level and well below the league average.  Simply put, opposing hitters were getting more ‘clutch’ hits against Greinke than would be expected. 

According to Baseball-Reference 
With runners in scoring position in 2010 opposing hitters hit .297
With men on base opposing hitters hit .275
With no runners on opposing hitters hit .249

There is no real reason to expect opposing hitters to hit better with runners in scoring position as they did in 2010 (opposing hitters in general do hit better with runners on base than they do with the bases empty).  Check out Greinke’s 2007 and 2008

2007 RISP .224, Men On .274
2008 RISP .234, Men On .268

In 2007 and 2008 Greinke got excellent results with runners in scoring position.  In 2010, of course, he did not.  Why?

2007 BABIP with runners in scoring position: .258
2008 BABIP with runners in scoring position: .295
2010 BABIP with runners in scoring position: .349

That stands out.  I’ve already mentioned that Greinke’s BABIP has been very stable.  So a more than 50 point jump between 2008 and 2010 seems to be nothing but bad luck in those situations.  And that number is likely to be closer to .300 in 2011-leading to less runs scoring and a lower ERA.

There is one concerning thing about Greinke, however.  Strikeouts.  Greinke’s K/9 in 2010 was well below his established norm and right around the league average. 


The following numbers are Greinke’s year-by-year percentages for pitches swung at and made contact with and swinging strike percentage. 

2007 78.3, 9.8
2008 79.5, 9.3
2009 77.7, 9.9
2010 82.8, 7.5

2010 looks a lot different.  Why?

Two obvious places to look are at Greinke’s pitch selection and his stuff.

Greinke’s pitch selection
2007 FB=66%, Slider=19%, Curve=8%, Change up=7%
2008 FB=62%, Slider=19%, Curve=12%, Change up=8%
2009 FB=59%, Slider=20%, Curve=14%, Change up=6%
2010 FB=61%, Slider=16%, Curve=11%, Change up=13%

Greinke is obviously using the change up more and his slider less.  This is strange because his slider has consistently been his best pitch and his change up his worst.  Also about half of Greinke’s fastballs in 2010 were classified as two-seam fastballs while less than 1% of his pitches the 3 previous seasons were so classified.

This chart shows Greinke’s runs saved per 100 pitches of each type for the last few years (high numbers are good. & negative numbers bad).

2007 Fastball = .57, Slider = .43, Curveball = 1.00, Change = -2.92
2008 Fastball = -.19, Slider = 2.49, Curveball = .14, Change = -1.53
2009 Fastball = 1.27, Slider = 2.90, Curveball = .50, Change = -1.21
2010 Fastball = .49, Slider = 2.34, Curveball = -1.91, Change = -.57

You can see that the slider is by far his most consistent pitch.  Why would he throw it less?  And why would it substitute his slider for his changeup, which is his worst pitch?  I don’t have any idea.  It’s worth noting that his change has been improving each year.  Also note that his curveball was an above average pitch for Greinke in 2007-2009 but was terrible for him this year.

I’m far from being an expert on Pitch F/X but I’ll look at the numbers quickly.


There’s no obvious decline in Greinke’s velocity


His curveball has shown a decrease in horizontal movement.  The decrease has been gradual which doesn’t explain why the decrease in effectiveness dropped off so quickly.

2007 8.1 inches
2008 7.5 inches
2009 6.1 inches
2010 4.5 inches

His slider has also shown a similar decrease in horizontal movement

2007 5.7 inches
2008 5.0 inches
2009 3.6 inches
2010 2.9 inches

So, what does it all mean?

First, Greinke v.2009 isn’t the Greinke we should be comparing to.  He pitched to the best of his capabilities and everything broke right for him.  We should be looking at Greinke’s 2007 and 2008 seasons as a baseline.

Greinke’s 2010 was a lot like his 2007 and 2008.  The only two differences were his left on base percentage, which should return to normal and his strike out rate.  Regarding his strikeout rate; he is pitching differently and his pitches are moving differently so does this strike out rate represent a new norm for Greinke?  I don’t know. 

For a projection I’ll say:
33 starts, 220 innings, 60ish walks, 190ish strike outs, and an ERA of 3.50 (give or take the standard half of a run).  So, basically, the same Zack Greinke we’ve seen since 2007-exluding his amazing 2009 and terrible LOB% in 2010.

Tuesday, November 9, 2010

Day Planners: November 9th

1999
Had a couple of classes at UNM
Was going to go to the gym and work on my arms
Needed to work on a 'newsbrief'.  Probably something for school
And I was going to study for "303".  And I was going to do it "outside".
Notes for this week included something about "Mug Girl"


2000
Headed to the gym in the morning with this note "last day to relax"
Then Class.  
At lunch I needed to print something for 426 (Advanced problems in financial management)
Still needed to change the wiper blades
And I planned on taking a bubble bath


2001
Work from 8:30 to 6:00.  Headed to the gym at lunch to work out my legs
Then a Lobo basketball game
And "Tommy" at 8:00
EDIT:  Thanks to my bro who reminded me that was the musical of The Who's Tommy.


2004
Doing cardio at the gym before work
Had a new client intake that day.  I remember her.  She was a sweet girl.
After work I needed to come home and vacuum.  
After vacuuming I had to pack for a trip to California!  :0)
Somehow I still thought I'd have time to go to another Lobo game


2008
Had to write an email to the guy I was renting an apartment from about borrowing his bicycle and the electric bill
I also needed a shave


2009
Get up and go to the gym.  Working out "Arms".  6 times left on the 10 times card
Svenskundervisning För Invandrare (Swedish For Immigrants).  My Swedish class
Then grocery shopping on the way home
That night I had something to do with "library books"
I also had to email Nina about the movie "Kvinan som lekte med elden".  Nina was one of my SFI instructors and we were supposed to write emails to her about Swedish TV shows or movies that we saw.
I was also going to watch Silent Library and tell my girlfriend that she was a 'Plughäst' - Swedish for 'work horse' since she had been working so hard on her PhD and I just learned that word in class.  

Monday, November 8, 2010

Player Review/Prediction: Nate McLouth


Nate McLouth entered 2010 coming off of two productive seasons.  One with the Pirates worth 4.6 WAR and a 3.0 WAR season split between Pittsburgh and Atlanta.  So, when he finished 2010 with a negative WAR value plenty of people were surprised.  Should we have been?

Well, yes. 

There wasn’t anything in McLouth’s 2008 and 2009 which raised any red flags for this kind of drop off.  So what happened?  Let’s look at some graphs to see if there are any trends that might point out the problem.


Walk rate looks ok


Strike out rate is definitely increasing.  But it isn’t so high as to suggest that McLouth would be one of the worst batters in baseball.


Batted ball profile isn't changing that much.  Line drive rate is decreasing.  That's not a good sign.


BABIP…dropped off of the table.  We have a lead.


Also a steady drop in power over the last two years.


So, what is going on?

Let’s look at the strikeouts first. 

At Fangraphs we can get an in depth look at McLouth’s swing habits. 

McLouth isn't swinging at more pitches out of the zone than normal: 21.2% in 2010, 21.3% career
McLouth isn't swinging more than normal: 40% in 2010, 40.3% career.
McLouth isn't making less contact than normal: 86.8% in 2010, 85.7% career.
Pitchers are throwing McLouth fewer strikes: 46.9% strikes in 2010, 50.5% career.

There’s nothing in his swinging that would indicate more strikeouts.  Must be something in his non-swinging.


http://www.baseball-reference.com/players/m/mclouna01-bat.shtml#batting_pitches::none
Prior to 2010 McLouth saw 3.90 pitches per at bat.  A patient hitter since league average is 3.78.  In 2010 McLouth saw 4.15 pitches per at bat. 

One downfall of being a patient hitter is that by taking more pitches you have the opportunity to take more 3rd strikes.  The league average for strikeouts looking (compared to total strikeouts) is around 25%.   McLouth strikes out looking over 30% of the time prior to 2010, and in 2010?   44% of his strikeouts were the umpire’s decision.  What does that mean for McLouth?  I don’t know?  Did he lose his batting eye?  Not likely since all of his swing rates were the same.  He wasn’t swinging at bad pitches, why would he take good ones?  Were all the umpires out to get him, ringing him up on anything close?  Also doubtful. 

McLouth did suffer a concussion on June 9th after colliding with Jason Heyward.  A concussion is unlikely to help his season at all, but McLouth had already struck out in 22% of his plate appearances prior to the concussion (compared to 13% after.  Maybe it did help). 

Moving on to BABIP…

McLouth’s .221 BABIP would have been the 2nd worst in baseball had he enough at bats to qualify.  So, that jumps out.  McLouth doesn’t have any history of poor BABIP’s, so what happened?

BABIP on flyballs: .149 (.140 MLB Average, .145 career average)
BABIP on groundballs: .149 (.240 MLB Average, .218 career average)
BABIP on line drives: .586 (.750 MLB Average, .680 career average)

In 2010 McLouth’s Batting Average/On Base Percentage/Slugging line was:
.190/.298/.322 – ugly
By changing McLouth’s 2010 BABIP to MLB averages we get:
.236/.328/.369
If we use his career averages (which include his poor 2010) instead we get:
.223/.316/.355
Neither of those lines are good, but they aren’t nearly as ugly.

What about McLouth’s power?

ISO, or Isolated Power measures a players power using the formula ISO = (2B + (3B*2) + (HR*3)) / AB
McLouth had ISO’s above .200 his two years in Pittsburgh.  In Atlanta his ISO has been about .155.  The first thing to look at is if the change in stadium could be making a difference.  We do this by using park factors 

PNC Park in Pittsburgh has the following Park Factors for left-handed batters:
2B = 98
3B = 83
HR = 99
wOBA = 100

Turner Field in Atlanta has the following:
2B = 90
3B = 102
HR = 95
wOBA = 97

So, Atlanta is a bit tougher on left-handed hitters than Pittsburgh is but probably not enough to account for all the difference. 

Part of the problem is obvious.  His decreasing flyball and linedrive rates will lead to less power.  Flyballs become home runs, and linedrives become doubles and triples.  Hitting less flyballs and linedrives will lead to less extra base hits. 

So, what to make of this mess?  I think ‘mess’ is the right word.  ‘Mess’ certainly describes McLouth’s 2010.  ‘Mess’ also describes how I feel about this post.  It’s not nearly as organized as I’d like, nor are the answers as cut and dry.  I think McLouth’s BABIP will come back.  His numbers, especially on line drives are just too low to be sustainable. 

The changes in strikeouts and power are a different story.  I don’t know what to make of his increase in called third strikes?  Did he change his approach at the plate?  Does it have something to do with his new contacts?  I don’t know

I think the drop in power is more real.  He’s hitting less line drives and fly balls in a stadium that’s a bit rough on lefties. 

So, what’s my prediction?  McClouth comes back in 2011.  He’s not as bad of a player as his 2010 showed.  However, I’m going to be conservative.  The strikeouts and lack of line drives worry me.  I’ll pessimistically say:
.240/.330/.400 in 2011 for McLouth.


With the caveat that there is a much better chance that he returns to being the exact same player he was in 2008 and 2009 than there is that he repeats 2010.  

Sunday, November 7, 2010

Day Planners: November 7th

1999: I was apparently meeting Jessi.
2000: Busy day
Gym in the morning.  Then a shower
Then banking class where we had a test.  There is a not that says 'Michelle'.  Dunno who that is
After the test I was heading to the library to research Rorschach ink blots.  That would eventually become one of my tattoos.
Then to work where I must have had a paycheck waiting for me.  Ca-Ching!
I also had a side note to buy new wiper blades
2001: Volunteering in the emergency room from 8:30 to 2:00
2004: Headed to Johnson field at UNM to do some jog/sprints before mowing the lawn and watching the Eagles and Steelers.  The game didn't go so well.
2008:  In Sweden.  Up early to head to the Skateverket (Tax Office) to get my Personnummer, Personbevis, and ID Card.
2009:  Absolutely nothing

Friday, November 5, 2010

Creation and Eternity


"Neither acting nor retracting, I bear tension and paradox, in an in-between state - the place between God's and Adam's fingers in Michelangelo's depiction of creation. " -- Veronica Goodchild

When I read those words I literally shook.  I was shocked, stunned, in awe.  It was the greatest thing I've ever read.  It conjured no emotion, nor defensiveness, nor thought in me.  For a fleeting eternity, that was my reality.  In a flash of three-dimensional blue I was there, suspended, between two fingers.  The fingers neither great, nor me small, but I, and the total of my existence, lived in that space.

A time line in old day planners

I was doing some cleaning and found a bunch of my old day planners dating back from 1999.


The 1999 version (bottom left) was from Sports Illustrated.  It was the first day planner that I used that I ever remembered to look at every day :0)

Because my life is utterly fascinating to everyone in existence I'm going to give everyone who reads this a glimpse into how I live my day to day life.

What was I doing on November 5th:
1999: I was living in Albuquerque and apparently working at a sandwich shop from 3 - 8 with someone named Steph(anie?).
2000: Still in Albuquerque.  Going to my cousins soccer game in the morning then coming home to do laundry and work on home work for a Banking course at UNM
2001:  Albuquerque.  Working for the army surplus store before my EMT class.  I also have a note that says "*Escort Girl* I have no idea what that means.  I'm fairly confident that I didn't hire an escort on that day....
2004:  Albuquerque.  Working in the office.  I went to the gym to swim laps on my lunch break.
2008:  Living in Solna Sweden.  I had a library book due.  I don't remember which one
2009:  Living in Upplands Vasby Sweden.  Went to the gym and had 7 visits remaining on my 20 times card.

Clearly November 5th hasn't been the most exciting day in my history.  Perhaps today will change that trend...

Thursday, November 4, 2010

Player Review/Prediction: Clay Buchholz


This time I’m going to take a look at a pitcher.  Boston’s Clay Buchholz burst on the scene by throwing a no-hitter in his second career start.  Boston fans must have been drooling after the Sox won their second World Series in 4 years and teammate and fellow prospect Jon Lester pitched a no-hitter in the beginning of the 2008 season.  Since then Lester has gone on to become one of the more dominant pitchers in baseball while Buchholz has struggled in the major leagues and spent significant time in the minors.  Until this year.


Buchholz finished 2nd in the AL in era with a 2.33 ERA and went 17 – 7.  Meanwhile Lester finished 19 – 9 with a 3.25 ERA.  The future for the Red Sox couldn’t be much brighter could it?  Lester is a Cy Young candidate and Buchholz just keeps getting better and better.  Look at these ERA’s.
2008: 6.75
2009: 4.25
2010: 2.33

If Buchholz is dropping 2 points off his ERA each season we should expect his ERA to be below 1.00 next year right?  Well, maybe not, but it should be in the 2.00’s right?  I’m going to tell you that it’s much more likely to be near 4.00.

Let’s take a look at some other stats:
Walks per 9, Strikeouts per 9, Home runs per 9, BABIP, and Left on Base Percent
2008: 4.86, 8.53, 1.30, .366, 60.5%
2009: 3.53, 6.65, 1.27, .289, 76.7%
2010: 3.47, 6.22, 0.47, .265, 79.0%

The first number that I want to focus on is Left on Base Percentage.  LOB% is the percentage of runners the pitcher strands on base.  The league average LOB% is around 72%.  In 2009 and 2010 Buchholz had higher than average LOB%’s but numbers that are somewhat reasonable.  In 2008 he stranded only 60.5%.  That means almost 40% of the runners that got on base against him scored.  That’s an unreasonable amount.  That low strand rate led to an inflated ERA.  So, the improvement between 2008 and 2009 wasn’t as significant as it first looks. 

Second, BABIP.  League average BABIP is about .295.  In 2008, Buchholz had a very high BABIP; lots of balls that should turn into outs were turning into hits instead.  Those extra hits lead to more runners, more runs and the low LOB%.  Again, his 2008 wasn’t as bad as it looked, and his 2009 wasn’t as much better than his 2008 as it looked. 

So, we’ve established that Buchholz’ 2008 was unlucky.  Now, let’s take a look at his 2010 compared to his 2009.  Two of the most important indicators of a pitcher’s ability are walk and strikeout rate.  Buchholz’ rates the last two years were very close to league average as these graphs will show


Guys with average walk and strikeout rates don’t usually post ERA’s nearly half the league average so why did Buchholz?  Let’s revisit BABIP and LOB%.  Both numbers were a bit on the ‘lucky’ side for Buchholz in 2010 which we’d expect to lead to a slightly reduced ERA.  But the number that really stands out is the homeruns per 9.  It is much lower this year than Buchholz’ first 2 years in the league.  So, the question of the moment is if Buchholz can expect to keep that number low.

The first thing that we will compare it to is the league average.  Buchholz was average on walk and strikeout rate how does his ability to control homeruns stack up?


The average number of homeruns per 9 is about 1.  Buchholz was a bit above average in 2008 and 2009 but way below in 2010. 

Now, certain pitchers can maintain a low HR per 9 rate.  Is Buchholz one of those pitchers?  The easiest way to avoid giving up homeruns is to keep the ball on the ground.  Buchholz does a very good job of keeping the ball on the ground.

*ground ball
*fly ball
*line drive

Buchholz had the 9th highest groundball rate of all AL starters.  So, he should be expected to have a low home run rate.  But that low?  We can also look at the number of home runs per fly ball. 
2008: 14.7
2009: 15.7
2010: 05.6
Buchholz’ 5.6% HR/FB rate in 2010 was the 2nd lowest amongst AL starters.  Unless Buchholz has some special ability to keep fly balls in the stadium we’d expect his HR/FB rate to increase next year.  Since his HR/FB rates in 2008 and 2009 don’t show this ability I see no reason to expect it to continue. 

What happens when we put it all together?  We get a guy who has average stuff (as evidenced by his strike out rate) and a guy who has average control (as evidenced by his walk rate).  This would lead me to believe we’ll get a guy with an average ERA.  The American League ERA was 4.14 last year.  Buchholz does keep the ball on the ground, which should limit the number of homeruns that he gives up, in turn reducing the number of runs he’ll give up.   

My prediction: Buchholz’ ERA between 3.50 and 4.50

Monday, November 1, 2010

Fashion Paradox: Looking like a Million Bucks

Five years ago, give or take maybe two years,  I bought two pairs of Canyon River Blues Cargo Pants from ?Sears?.  I paid $5 each for them.  In my opinion any pair of pants that cost a dollar a year to use is an impressive purchase.  I often brag about these pants.


Now...they are starting to show a little wear.  The cuffs are frayed.  Each of the multitude of pockets are frayed.  The colors have faded.  They're a little baggy as I bought them around the height of my out-of-shapeness.  But they cover everything that they need to cover and keep me warm when it's too cold for shorts.

I had a girlfriend who said that I looked homeless when I wore them.  My mom recently said that I need to buy some new pants because these looked like I paid $5 for them 5 years ago-she didn't mean it as a compliment.

So, I was looking at my pants today and thinking-thinking how backwards the thinking about my pants is.

If I spent a lot of money to buy a 'nice' pair of pants I'd have less money in my (figurative) pocket right now.  But since I paid less money then, I have more money now.  But people say that I look poor...

I often think that people are thinking exactly opposite of the way they should-this is one of those times.