Monday, December 23, 2013

What is an Ace? 2013

After the 2011 season I asked, and attempted to answer, the question, "what is an ace"?

It's time to do that again.


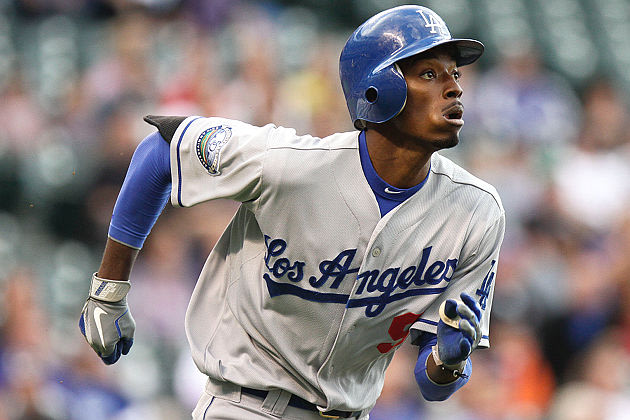
Ok.  While Kershaw is the aciest of aces right now, that's not really the answer that we're looking for.

What I did was to take the average of every starter's fWAR and RA-9 WAR.  Then I used that number to group pitchers into groups of (roughly) 30 - 30 aces, 30 number 2's, etc.  Then, I looked at the average performance of the pitchers in each group.

Here's what I found:
*click to embiggen

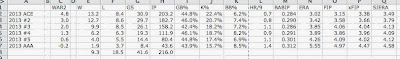
There's a couple of interesting things to note.

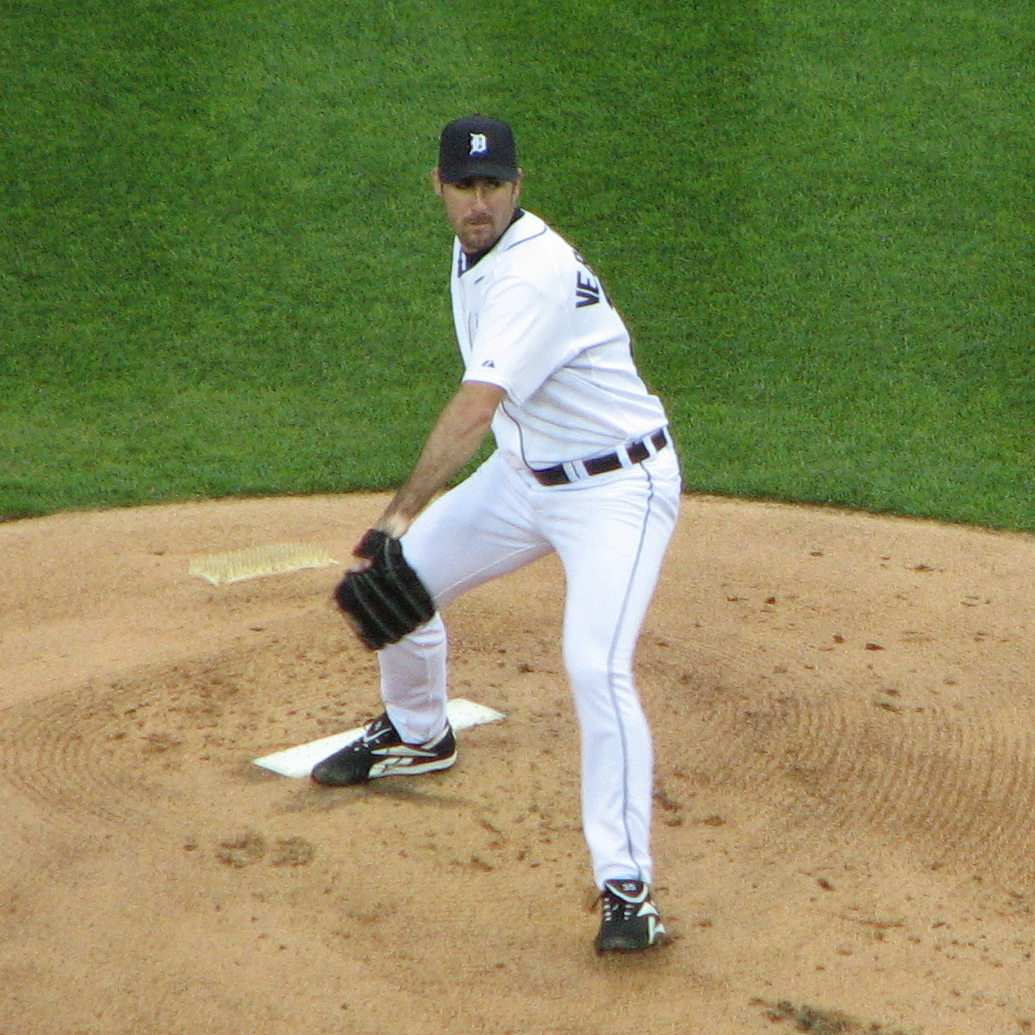
One is that the best 30 pitchers in baseball are, far and away, the best group.  They strike out the most hitters, they walk the least hitters, they give up the least home runs, they have the lowest BABIP, they're the best.  That's not surprising when guys like the above-picture Kershaw, Cliff Lee, Max Scherzer, Justin Verlander, Matt Harvey and Yu Darvish are in the ranks.

The second interesting thing is how similar the #3, #4 and #5 groups are in terms of performance.  Look,
#3 18.2% K, 7.2% BB, 3.85 ERA, 4.06 FIP, 4.04 xFIP, 4.13 SIERA
#4 18.7% K, 8.2% BB, 3.89 ERA, 3.86 FIP, 3.96 xFIP, 4.09 SIERA
#5 17.4% K, 6.9% BB, 4.26 ERA, 4.09 FIP, 4.02 xFIP, 4.12 SIERA

In many ways, every way other than walks really, #4 starters outperformed #3 starters.  Well, in every way except for number of starts and innings.  Number 3 starters made about 7 more starts and pitched almost 50 more innings than #4 starters.  Similarly, #5 starters were a little worse than both #3 and #4 starters but what really limited them from producing value was that they made 12 less starts and pitched half as many innings as #3 starters.

The third point is similar to the above.  Starters not in the top five accounted for more starts and more innings than the best pitchers in baseball.  That makes sense when you stop to think about it, there are more bad pitchers than elite ones, but we don't think about just how important it is for the other starters to make their starts so these guys don't have to.


As I mentioned when I first did this little exercise after the 2010 season,

Next time your team signs a pitcher with a 10 - 8 record and 3.99 ERA in 160 innings realize just what you are getting.  One of the top 100 pitchers in the league.  

The numbers are a little different now - now the average #3 is 10 - 9 with a 3.85 ERA in 158 innings - but the point remains the same; the average baseball fan vastly underrates pitcher performance.


Contract Analysis: Chris Perez (&Jamey Wright)

The Dodgers have agreed to a deal with Chris Perez.

Perez is the former Cleveland Indians closer who was also busted for ordering shipments of marijuana to come to his house under his dog's name.

When Perez was first released by the Indians I hoped the Dodgers would give him a look.  Obviously, they did.

Unfortunately, I took another look as well.

Over the last 3 seasons Perez:
K'd 20.7% of hitters, walked 8.6%, gave up line drives 21% of the time, 3.73 ERA, 4.21 FIP, 4.18 xFIP, 3.67 SIERA, 0 fWAR, 1.4 RA-9 WAR

Let's compare those numbers to the numbers of recently released Ronald Belisario:
K'd 20.1% of hitters, walked 9.7%, gave up line drives 21% of the time, 3.24 ERA, 3.36 FIP, 3.46 xFIP, 3.16 SIERA, .7 fWAR, .9 RA-9 WAR

*stats from FanGraphs

Belisario is, more than arguably, better than Perez, but the Dodgers decided to let Belisario walk away. I don't understand.

But, that's the past.  How about the future?
STEAMER and Oliver projections project:
Perez for 21.4% K's, 8.3%BB's, 4.12 FIP and -.1 WAR per 55 innings
Belisario for 19.4% K's, 10.1 BB's, 3.73 FIP and .2 WAR per 55 innings

Belisario still comes out better.

Terms of Perez' deal haven't been released, but hopefully it's nothing more than a couple of million with incentives.


Jamey Wright also signed.  I like this move better.
How do his numbers look?
Last 3 seasons:
K'd 19% of hitters, BB'd 9.4%, gave up line drives 19% of the time, 3.32 ERA, 3.60 FIP, 3.69 xFIP, 3.41 SIERA, .6 fWAR, 1.3 RA-9 WAR.

and STEAMER and Oliver projections?
18.8% K's, 9.0% BB's, 3.64 FIP, 0.9 WAR per 55 innings.

*stats from FanGraphs

He looks like the best of the bunch.


That leaves the Dodger bullpen looking something like:
Closer - Kenley Jansen 68.3 innings, 13.0 K/9, 2.9 BB/9, 2.18 ERA, 2.35 FIP, 1.2 WAR
HL R - Brian Wilson 32.3 innings, 8.6 K/9, 3.6 BB/9, 3.27 ERA, 3.39 FIP, 0.3 WAR
HL L - Paco Rodriguez 46.7 innings, 10.9 K/9, 3.6 BB/9, 3.02 ERA, 3.10 FIP, 0.4 WAR
ML L - JP Howell 50.7 innings, 7.9 K/9, 3.7 BB/9, 3.42 ERA, 3.64 FIP, 0.1 WAR
ML R - Chris Perez 55.7 innings, 8.3 K/9, 3.2 BB/9, 3.88 ERA, 4.12 FIP, -0.1 WAR
LL R - Jamey Wright 42 innings, 7.3 K/9, 3.5 BB/9, 3.61 ERA, 3.64 FIP, 0.1 WAR
LL R - Brandon League 61.7 innings, 6.2 K/9, 2.9 BB/9, 3.76 ERA, 3.72 FIP, -0.1 WAR

With the following waiting in AAA
Chris Withrow - 64.3 innings, 9.5 K/9, 4.7 BB/9, 3.58 ERA, 3.81 FIP, 0.1 WAR
Jose Dominguez - 49.3 innings, 8.9 K/9, 5.3 BB/9, 4.15 ERA, 4.15 FIP -0.1 WAR
Onelki Garcia 47.7 innings, 8.0 K/9, 5.6 BB/9, 4.37 ERA, 4.53 FIP, -0.4 WAR
Scott Elbert - 24.3 innings, 8.5 K/9, 3.7 BB/9, 3.52 ERA, 3.84 FIP, 0.0 WAR
Javy Guerra - 55.3 innings, 7.3 K/9, 3.7 BB/9, 3.98 ERA, 3.95 FIP, -0.2 WAR

*Combined projections from STEAMER, Oliver, and ZiPS

These moves push Chris Withrow to AAA.
Elbert and Guerra are out of options and will need to be traded or released.
Rule V pick Seth Rosin doesn't look to have a spot and will have to be offered back to the Mets (along with $25000) or a trade will have to be worked out.


Saturday, December 21, 2013

2013 Pitcher Plus

I've taken the following stats: line drive %, ground ball %, fly ball %, infield fly ball %, home run per fly ball %, walk %, strike out %, SIERA for every player that pitched in the majors in 2013 and divided their rate by the rate for their league.  I further separated starters and relievers.

Two examples,
*click to embiggen


For Kershaw, his LD%+ of 108% means that he gave up line drives at 108% of the league rate - 8% more than the average NL starter.  His BB%+ means that he walked hitters at 66% of the rate of the average NL starter.

Kenley Jansen's SIERA indicates that his SIERA was 41% of the league average SIERA.


Here's the link to the complete spreadsheet.


Wednesday, December 18, 2013

A quick note on lead-off hitters

The prevailing wisdom for a long time was that lead-off hitters needed to be fast and steal lots of bases.

The modern wisdom is that lead-off hitters need to get on base.


I was involved in a discussion regarding this and broke out the Excel sheet so I figured that I'd do a quick post.


I took a look at how often runners score compared to their ability to steal bases and their ability to get on base.  I looked at all hitters from 2013 who had more than 200 PA's.  I looked at runs scored/PA.  I looked at SB/PA.  And I looked at OBP.

Here's what I found.


You can see that in the top graph of Runs & OBP.  As OBP (the horizontal axis) gets bigger the number of runs per plate appearance also gets bigger.  

In the bottom graph as the number of stolen bases per plate appearance gets bigger so does the number of runs per plate appearances.  But the relationship is not nearly as well defined as in the top graph.

The number in each graph, the r-squared value, tells the strength of the relationship between the two variables.  A perfect correlation where in each instance as one variable goes up so does the other would have an r-squared of 1.  A correlation where the two variables had nothing to do with each other would have an r-squared of 0.

We can see that the r-squared for the bottom graph (stolen bases and runs scored) is .09.  That's very close to zero, meaning there's very little relationship between stolen bases and the number of runs scored.  In the top graph, the r-squared is .34.  That's a much stronger relationship between OBP and number of runs scored.  

Tuesday, December 17, 2013

Cards Squared

I took a look at just how much depth the Saint Louis Cardinals have.


Former Dodger Prospects in 2013

It's the time of the baseball year where we look at team's prospects.

Prospect lists are coming out.

We wonder who our teams could trade our prospects for or what prospects they could get in return.

We wonder if our prospects will make the metamorphosis from prospect to big leaguer.

Well, I'm going to take a quick look at how former Dodger prospects have fared with other teams.

These 10 pitchers have been recently traded by the Dodgers and appeared in the majors last season: Nate Eovaldi, Josh Lindblom, James McDonald, Steven Ames, Steve Johnson, Rubby de la Rosa, Josh Wall, Allen Webster, Luis Garcia, and Brian Morris.

They combined to go 17-31 in 372 innings last season with a 5.03 ERA, 4.68 FIP, 4.57 xFIP, 4.60 SIERA and -.6 WAR.
*source

Overall, it doesn't look like the Dodgers gave up too much value.
The best performer was Nate Eovaldi who was traded for Hanley Ramirez.  Eovaldi was 4-6 with a 3.39 ERA in 106 innings for the Marlins last year.  He had ad 3.59 FIP, 4.15 xFIP and was worth 1.5 WAR.  That was a solid season, but certainly nothing like what Hanley Ramirez (5.1 WAR) did.

Other than that, there wasn't much success.  Josh Lindblom (traded with Ethan Martin for Shane Victorino) pitched 31 innings for the rangers with a 5.46 ERA but 4.42 FIP and 4.50 xFIP worth .4 WAR.

Two highly thought of pitching prospects were traded to Red Sox in the mother of all trades Gonzalez, Crawford, Beckett, Punto trade.  Allen Webster and Ruby de la Rosa went 1 - 4 with a 7.78 ERA (6.26 FIP, 5.19 xFIP, 4.84 SIERA) worth -.4 WAR in 42 innings.


The hitters the Dodgers traded fared a bit better.  Carlos Santana, Andrew Lambo, Tony Abreu, Blake DeWitt and Andy LaRoche combined to hit .265/.359/.448 for a .352 wOBA which was 27% better than the league average hitter in 830 PA's.  Their overall WAR was 3.9.
*source

Most of that was Carlos Santana who went to the Indians in 2008 for Casey Blake's salary.  Santana hit .268/.377/.455 in 642 PA's.  That's good for a .364 wOBA (35% better than the league average hitter) and 3.6 WAR.


The Dodgers have traded more than a few players over the last few seasons, only two of them (Eovaldi and Santana) provided substantial value in 2013.

Sunday, December 15, 2013

Dodger infield: Juan Uribe and Mark Ellis

The Dodgers didn't pick up Mark Ellis' option for about $4 million.

Now he's signed with the Cardinals.  I don't know for how much, but I'd guess something around $3-$4 million.  

The Dodgers didn't feel they needed Ellis as a starter after acquiring Yasiel Puig Jr Alexander Guerrero.    I hope they are right, but I don't see a reason that they shouldn't have picked up Ellis' option.  If Guerrero is capable of manning the position from Opening Day then the Dodgers shouldn't have had much problem trading Ellis (the Yankees still don't have a starting 2Bman).  At least that way they would have picked up something in return instead of letting him go for nothing.  And, if Guerrero isn't ready, then they have a perfectly acceptable starting 2Bman.  

That he signed with the Cardinals is somewhat interesting.  Dodger fans won't forget that it was the Cardinals that dispatched the Dodgers from the playoffs last season.  Cardinal fans know that the Cardinals are in much the same situation as the Dodgers at 2B this year.  Where LA has Alexander Guerrero, Stl has Kolten Wong.  Wong is a highly rated prospect but has the same questions as Guerrero - can he repeat his success at the major league level.  The Cards got Ellis as insurance.  The Dodgers went without.


The more important move, though, was the Dodgers re-signing Juan Uribe.  While I was hoping that the team would sign, first, Joel Peralta (who went to the Cardinals), then, Omar Infante the Dodgers ended up with Uribe.

Everyone knows how terrible Uribe was in 2011 and 2012 so I won't post the grisly numbers.  As bad as he was those 2 years he was that good in 2013.  He went from hitting at about half of the league rate to hitting 16% better.  Some of it was batted ball luck (.240 BABIP to .322 and 4.5% HR/FB rate to 10.5%), the rest was...I don't know.  His peripherals are all similar.  Some was made of Uribe being in better shape.  Hard to believe that is the entire cause.  

Anyway, expectations have to be tempered regarding Uribe.  He's probably not going to be as good in 2014 as he was in 2013.  ZiPS, STEAMER and Oliver projections have Uribe hitting .243/.304/.392 and 2.2 WAR in 550 PA's.  That sounds about right.  That's a bit worse than league average hitting combined with some plus defense making Uribe a useful player.  

Also hard to overlook Uribe's place in the clubhouse.  According to AJ Ellis, "If you ask everyone in this clubhouse who is their favorite teammate, 95 percent will tell you Juan Uribe"

If Uribe provides 2 WAR of value in 2014 then he will have earned nearly all of his $15 million contract before it's half over - good value despite the forthcoming comments from people when Uribe's hitting exactly as described above.

After Peralta and Infante were taken off the market, Uribe was really the only reasonable choice.  That the Dodgers got him is no problem.

Let's all hope for 2 more seasons of the Uribear.

*http://www.mikesciosciastragicillness.com/2013/11/12/2013-dodgers-review-xx-3b-juan-uribe/


Thursday, December 5, 2013

Will Smith trade: A-Ok(i) for the Brewers


The Milwaukee Brewers traded Aoki to the Royals for Will Smith.


#Brewers announce trade of Norichika Aoki to #Royals for Will Smith.


 Aoki's been a good player the last 2 seasons for the Brewers since coming over from the NPB.  But he was in his last year of his very team-friendly contract and Khris Davis was knocking at the major league door.


STEAMER and Oliver combine to project Aoki for a .288/.355/.393 line and 2.4 WAR per 600 PAs
STEAMER and Oliver combine to project Kris Davis for a .253/.331/.449 line and 1.7 WAR per 600 PAs

That's roughly equal contributions.  Aoki looks to be a bit better but it's less than a WAR and there could certainly be some error bar overlap.

Will Smith was a pretty highly rated prospect for the Royals.  He made 16 decent starts for the Royals last season.  Putting up a remarkably consistent 4.66 FIP, 4.64 xFIP, 4.69 SIERA line.  The Royals moved him to the bullpen this season, which can't really be seen as a good thing since their rotation was so bad, and he was excellent as a reliever.  He K'd over 30% of the hitters he faced while only walking about 5%. He had a 3.53 FIP, 2.50 xFIP and 2.05 SIERA.  The last 2 numbers being particularly dominant

In giving up Aoki, a good, but but not much more than good, player the Mariners got back about the max of what could be expected.  A pitcher who looks like a better than average reliever who'll cost basically nothing for 3 seasons and who could work his way into the starting rotation.


For the Royals...I don't like it as much


We saw that Aoki was projected for about 2.4 WAR per 600 PA's
The same projections have David Lough and Maxwell producing about 1.9 WAR per 600 PAs

Aoki's acquisition is only about a .5 WAR upgrade.

For that, they give up the same thing that Milwaukee acquired - Will Smith and his above average relief work and possible ability to start.

Wednesday, December 4, 2013

Brian Wilson: what (not) to expect


A lot of rumors about Wilson coming back to pitch for the Dodgers next season.

I'd be ok with that.  I might prefer someone like Joaquin Benoit though.  STEAMER projects Wilson for a 3.50 FIP next season and Benoit for a 3.16 FIP.

The latest rumor has Wilson taking a 1 year deal with a player option for 2015.  I'm not a fan of player options.  If Wilson pitches well, he can opt out and become a free agent.  If he's terrible, or injured again, the Dodgers are on the hook for however many millions.

But that's all kind of besides the point of this post.


Wilson only faced 49 major league hitters last year, so looking at his .66 ERA (or 2.02 FIP or 2.82 xFIP or 2.66 SIERA) isn't really helpful.

What we can look at are his pitches.  The common refrain was that Wilson's pitches were back.  Were they?

In 2009 and 2010[/URL] Wilson's pitches were like this
62% 4-seam fastballs at 97.0 MPH with 3.4 inches of horizontal movement and 8.9 inches of vertical movement.
35% cutters at 89.5 MPH with 2.5 H-movement and 1.4 V-movement
*BrooksBaseball

This season Wilson threw
70% cutters at 89.5 MPH with .5 H-movement and 3.9 V-movement
15% 4-seam fastball at 94.4 MPH with 4.4 inches of H-movement and 8.2 inches of V-movement
13% sinkers at 94.4 MPH with 8.6 inches of H-movement and 6.1 inches of V-movement
*BrooksBaseball

First thing that's easy to notice is that Wilson has greatly increased his cutter usage.  He's maintained his speed on his cutter but the movement is much different.  His cutter now has virtually no horizontal movement but he's added a bit of vertical movement.

In 2013 13% of Wilson's pitches were classified as sinkers.  Does he throw a sinker now?  I don't know.  His sinker is similar to his 4-seam fastball in terms of speed and direction of movement.  Were those sinkers just fastballs with a different movement?  Maybe.

Either way, his fastball has lost about 3 MPH.  Depending if those sinkers are misclassified fastball or not, his movement might be similar, or he's gained significant horizontal movement.


As I said, I'm ok with the Dodgers bringing Wilson back.  We just shouldn't expect him to be the 2009-2010 version or his 2013 results.

Monday, December 2, 2013

Ronaldo Belisario is Jim Johnson

Jim Johnson was traded tonight from the Baltimore Orioles to the Oakland A's for Jemile Weeks.  Johnson will make $10 million dollars this year.

Ronaldo Belisario might get non-tendered by the Dodgers because they don't want to pay him about $3 million.


But, they are the same guy - outside of 100+ SAVEZ for Johnson

Over the last 3 years
Belisario: 20% K's, 10% BB's, 63% Ground balls, 3.36 FIP, 3.46 xFIP, 3.16 SIERA, 3.88 TIPS
Johnson: 17% K's, 6% BB's, 61% Ground balls, 3.30 FIP, 3.47 xFIP, 3.07 SIERA, 3.92 TIPS
*source

And last season,

Johnson gave up 0 runs in 60 of his 74 outings
Belisario gave up 0 runs in 58 of his 77 outings

Johnson gave up 1 or 2 runs in 12 of his 74 outings
Belisario gave up 1 or 2 runs in 17 of his 77 outings

Johnson gave up 4 runs once and 5 runs once
Belisario gave up 4 runs once and 5 runs once

*Johnson's game log
*Belisario's game log


Saturday, November 23, 2013

Imagination gone wild: What if Prince Fielder were a SS?

I was recently involved in an online discussion of the Prince Fielder/Ian Kinsler trade and the signing of Jhonny Peralta by the St. Louis Cardinals.  Someone stated that Peralta was no more than a utility infielder who could sometimes hit.  I pointed out that, over the last 3 seasons, Peralta was actually a top 5 SS.  Someone else stated that Prince, were he to play SS, would also be a top 5 SS.  I thought that was ridiculous, but decided I'd try to look at it as objectively as possible.


Over the last 3 seasons, Fielder has 111 batting runs, -18 base running runs, 61 replacement runs and -10 fielding and -37 positional runs for 107 total runs.
*source


If we assume that his batting, base running and overall playing time would stay the same, which is probably an optimistic assumption given the likely additional strain of playing SS instead of 1B, then we only need to adjust his positional and defensive runs.

The positional adjustment is the easiest to adjust.  The adjustment for 1B is -12.5 runs per 1350 innings, the adjustment for SS is +7.5 runs per  1350 innings.  Fielder's -37 positional runs represent (-37/-12.5) 3.0 defensive seasons.  Three defensive seasons at SS is worth (3 * 7.5) 23 runs.

At this point Fielder at SS is worth 111 batting runs+-18 base running runs+23 positional runs+61 replacement runs.  That's 167 runs all told.  That'd make him, by far, the best SS in the league.  Troy Tulowitzki has 114 runs.

But we still haven't factored in Fielder's defense compared to the average SS.  I'm not really sure that we can.

Fielder has been about 6 runs worse than the average 1B each season of his career.  But the average SS is a much better defensive player than the average 1B.

I think it's safe to assume that Fielder would be the worst defensive SS in baseball.

Since 2002, the UZR era, the worst season by a SS (minimum 650 innings, about half a season) is Dee Gordon's 2012 season in which UZR says he was worth -27 runs per 1350 innings.
*http://www.fangraphs.com/leaders.aspx?pos=ss&stats=fld&lg=all&qual=650&type=1&season=2013&month=0&season1=2011&ind=1&team=0&rost=0&age=0&filter=&players=0&sort=25,a

That's a somewhat amusing comparison.  Dee Gordon is listed at 5'11" 160 lbs.  Prince is listed at 5'11" 275 lbs.  Those are listed weights and I think it's entirely possible that Prince weighs twice as much as Gordon.

http://forums.prosportsdaily.com/showthread.php?813284-Easiest-defensive-position-to-play-in-baseball/page6


http://ca.sports.yahoo.com/blogs/mlb-big-league-stew/juice-marlins-beat-giants-bury-may-rays-win-121523585.html


I'm going to go out on a limb as say that Prince would be a worse defensive SS than Gordon.  I'd go so far as to say that he would be considerably worse.  But how much is considerably?


UZR can be broken down into different components.
Range runs - attempts to measure a player's range; how many balls he does/doesn't get to compared to average.
Error runs - attempts to measure how many runs a player saves/costs his team by avoiding/making errors
Double play runs - attempts to measure how many runs a player saves/costs his team by turning/not turning double plays.

I'm going to assume that Fielder would be the worst at all 3 of the above.  So, what would that look like for Fielder's overall defensive worth at SS?

It's worth noting here that most of Gordon's poor UZR was due to making errors, his range and double plays were bad, but not historically bad.  His errors were.

The worst SS in terms of double play runs (per 1350 innings) was, go figure, 2012 Dee Gordon at -5 runs per 1350 innings.  If we say that Fielder was equally as bad as Gordon, I've little doubt he'd be much worse than Gordon, that'd be (3*-5)-15 runs over the 3 seasons.

The worst SS in terms of range runs was, not surprisingly, 2012 Derek Jeter at -17.5 runs per 1350 innings.  Anyone think that Fielder has Jeter's range?  I don't.  But if we give Fielder 3 seasons as poor as Jeters' 2012 that's (3*-17.5) -53 runs for 3 seasons.

The worst SS in terms of error runs, bet you guessed that it, was 2012 Dee Gordon at -13 runs per 1350 innings.  Again, I think that Dee's footwork and hands around 2B would be much better than Fielder's, but if we say that Fielder was as good as Gordon then he'd be worth (3*-13) -39 runs per the 3 seasons.

If we add all of that up (and remembering that this is-I believe-an optimistic look at Fielder's possible performance at SS, we get Fielder being (-15-53-39) -107 runs worse than the average SS.  Quite a bit worse than Gordon's -27 runs

Let's add that to his other performance from above:
111 batting runs, -18 base running runs, -107 fielding runs, 23 positional runs, 61 replacement runs = 71 total runs.

71 total runs between 2011 and 2013 would have put Fielder 12th among major league SS, between Hanley Ramirez (84 runs) and Marco Scutaro (70 runs), and worth about 2.5 WAR per season.
*http://www.fangraphs.com/leaders.aspx?pos=ss&stats=bat&lg=all&qual=y&type=6&season=2013&month=0&season1=2011&ind=0&team=0&rost=0&age=0&filter=&players=0

To emphasize again, I think these are the most ridiculously optimistic assumptions that I can present with a straight face.  I think it much more likely that Fielder would be a -50 (per 1350 innings) or worse SS were he to play there everyday.  Not to mention the additional strain on his body that would decrease his hitting, baserunning, and ability to play everyday.

Wednesday, November 20, 2013

Trade Analysis: Ian Kinsler for Prince Fielder

The first blockbuster of the 2013-2014 off season!

All the details aren't out yet but I'm going to look at the deal just a straight swap.


Per Clay Davenport transactions,
Ian Kinsler is expected to produce 81.6 runs over the next 3 seasons and will be paid $46 million to do so.  Assuming $5.5 million for 10 runs in 2014 and 5% inflation each year the value of Kinsler's production is worth $47 million.  We'll call that a wash.  Kinsler will be paid exactly for his expected production.
*http://www.claydavenport.com/ht/KINSLER19820622A.shtml

Prince Fielder is expected to produce 214.3 runs (assuming 20 runs in his final year - a 5 run drop from the previous season) over the rest of his contract and will be paid $168 million to so do.  With the same assumptions, the value of Fielder's production is $134 million.  That's substantially less than the $214 million that he'll be paid.

Right off this looks like a huge win for the Tigers.

But, let's look at the deal a little differently.  Let's just look at the next 3 seasons.
Kinsler's expectancy doesn't change.  He'll produce 82 runs for $46 million.

Prince is expected to produce 111 runs while being paid $72 million.  The value of that production in $64 million.  

Prince is expected to produce 30 more runs than Kinsler over the next 3 seasons.  That's significant.  He'll also be paid $26 million more to do it - that's also significant.   With that $26 million the Tigers should be able to buy ($26 million / ($5.5/10)) 45 more runs on the open market.  Possibly in the form of a 3rd baseman to replace Cabrera who'll move to 1st or to Max Scherzer who could have been traded.


What hasn't been considered so far, and what is very difficult to fully consider, are the other dominoes.  Now, Jurickson Profar will move into the Rangers' starting line up.

Profar is projected to produce 97 runs over the next 3 seasons.  That certainly mitigates the loss of Kinsler.  He'll be doing so at near the league minimum as well.   The Rangers will now have Mitch Moreland available for trade or to move to the OF.  That also adds to the value from the Rangers' end.
*http://www.claydavenport.com/ht/PROFAR19930220A.shtml

The Rangers might be a better team over the next few seasons with Fielder instead of Kinsler.  Still, unless major prospects or major money is changing hands, it's hard to see this as anything but a win for the Tigers.


UPDATE:  The Tigers will send $30 million to the Rangers to cover part of Fielder's salary.  Incidentally, that's exactly the amount that the above analysis indicated that Fielder was expected to be paid in excess of his production.  


Saturday, October 26, 2013

2013 Free Agent Team - Review

Well, the 2013 season is over - except for the World Series.

But who cares about that, right?

What everyone really cares about is how my 2013 Free Agent Team did?

Last offseason I gave myself an imaginary $100 million with which to sign players to my imaginary team and see how they'd fare this season.

Here's a reminder of who I picked and how much I paid them.

*click to make bigger

I think I did pretty well estimating the contracts the players would sign for.  

 I offered a total of 25 contracts for a total of $98.7 million.  23 of those players actually signed, and for a total of $87.3 million.  A few players I wanted to sign did not sign.  I offered $6 million to Roy Oswalt  and minor league contracts to Kevin Millwood, Jamey Moyer and Dana Eveland.  Millwood retired and nobody else bit on Oswaly, Moyer or Eveland.  If they had signed for what I had offered my total contracts would have to $94 million.  Very close to the $98 million I projected.
So, how'd the team do?

*Click to make bigger

Not too well.  For my $100 million I only bought 10 Win Above Replacement.  With replacement level being at about 48 wins my team would have won in the neighborhood of 58 games.  Only the Astros won less games than that and their payroll was about a fifth of mine.  

So, where'd I go wrong?
Like 2012's team, my starting pitching didn't really perform.  Only 2 of my starters made anything like a full season's worth of starts and I didn't even have a 5th starter since none of Jamie Moyer, Kevin Milwood or Dana Eveland pitched in the bigs.  Roy Oswalt and Jeff Francis only managed about 100 innings between them.

The hitting wasn't much better.
Half of my non-pitchers performed below replacement level.
I whiffed really bad on Macir Izturis whose .236/.288/.310 line was 2 wins below replacement.  It looks worse when I considered Kelly Johnson who managed 1.2 WAR.
Jeff Keppinger wasn't much better.  He managed -1.5 WAR.
My starting SS, Alex Gonzalez, was an absolute disaster.  He cost the team 1.1 WAR.  Luckily he only got 118 PA's or it could have been worse.
Kevin Youkilis also only managed 118 trips to the plate.  He cost me another .4 WAR.  At least he cost the Yankees that as well.
Melky Cabrera disappointed me and the Toronto Blue Jays.  He was worth negative .9 WAR.

So what'd I do right?
The biggest win was my gamble on Francisco Liriano.  He had a great bounce back season worth 3.1 WAR. 
I also did very well with another Pirate, Russ Martin.  Martin helped the Pirates to the playoffs with his 4.1 WAR season.  He helped my team win more games than the Astros.  
My backup catcher, Humberto Quintero, was also solid.  He put up .6 WAR in limited duty.
Nick Swisher had an ok season worth 2.4 WAR.  Not nearly what I expected when I handed him $17 million this year - the biggest contract I gave out.
Angel Pagan gave me just over 1 win.  I should have went with Shane Victorino instead.
Eric Chavez peformed well in limited duty.  His .7 WAR helped.

My bullpen was ok.  They managed just under 2 WAR.  High dollar (for me) Matt Lindstrom was excellent - I don't know why teams underrate him so?  Jamey Wright and Chad Qualls were productive as well.

There it is.  A very mediocre use of $100 million (and a few hours as well).

I'm getting ready to start my 2014 team.  I hope I do better.  


Tuesday, July 23, 2013

New Dodger: Alexander Guerrero


The Dodgers recently (yesterday or today) threw their financial might around again.  This time they signed Cuban 2B/SS Alexander Guerrero.

*http://www.juventudrebelde.cu/multimedia/fotografia/49-serie-nacional-de-beisbol/alexander-guerrero/

I've never heard of the guy before so I don't know anything about him.  The internet has helped out and this is what I've been able to find:

His last 3 seasons in Cuba he hit something like .330/.410/.610 in 886 PA's with 60 home runs.

How's that compare to two recent Cuban players?
From 2010 to 2011 Yasiel Puig and Yoenis Cespedes hit
Puig: .330/.430/.581 with 17 HR
Cespedes: .333/.424/.667 with 33 HR

So, he's comparable to those guys.


How have Puig and Cespedes hit in the majors?
If you've stumbled upon this blog you've probably heard of Puig.  He went Babe Ruth for his first 150 PA's in the majors.  He's since cooled off.  Cespedes was excellent last season but has struggled in 2013.

All told Cespedes and Puig have hit .283/.343/.489 in 1057 major league PA's
*source

If he can play 2B or SS or 3B and hit like that then he's an All-Star.  The only infielder in the majors this year with a .340/.450 ish line is Manny Machado.
*source

I don't think we should expect Guerrero to be Manny Machado.


Another thing to note is that both Puig and Cespedes walked more than they struck out in Cuba.  They've struck out about 3 times as much as they've walked in the majors.  That indicates a serious difference in the talent levels of the pitchers that they are facing.


Guerrero signed for $32 million over 5 seasons.  Puig signed for $42 million for 7 seasons and Cespedes for $36 million over 4 seasons.

Guerrero's contract was the smallest of the three.  $10 million less than Puig received for the same length and about half as much per year than Cespedes'


So, what can we take away from this?  I have no idea really.  Guerrero put up similar offensive numbers to Cespedes and Puig in Cuba.  We're still trying to figure out exactly how those guys will hit in the majors though.

The scouts and the guys involved in the million dollar contracts don't seem to think that Guerrero is as good as Puig or Cespedes.

At about $5 million a year he doesn't have to be an All-Star.  He doesn't have to be an All-Star to be an upgrade to the Dodger infield.

I can't wait to wait and see.


Other Links used
http://www.mikesciosciastragicillness.com/2013/07/23/report-dodgers-sign-cuban-shortstop-alexander-guerrero-to-732m-deal/
http://www.chadmoriyama.com/2013/07/dodgers-sign-cuban-shortstop-alexander-guerrero-for-32-million-according-to-report-video/
http://www.fangraphs.com/blogs/cuban-of-yasiel-puig-declared-free-agent/


Sunday, July 14, 2013

Why do we love no-hitters?


This isn't my idea and it's been brought to recent light by Brian Kenny.

https://twitter.com/MrBrianKenny/statuses/352416418056257536
Why fascination w/ no-hitter?Because in formative years of baseball, walks were considered a pitcher's responsibility, not a batter's skill

https://twitter.com/MrBrianKenny/statuses/352419081082773505
Yes, I'm saying it: No-hitters, hitting streaks - antiquated notions.  From a time where we are baseball values were misguided.

No-hitters are...?cool?...I enjoy them.  But what do they mean?
Nothing really

Lincecum pitched a no hitter yesterday, you may have heard.
9 innings, 0 hits, 0 runs, 4 walks, 1 hit batter, wild pitch, 13 K's, 148 pitches.

Though it'll be the game that goes down in history, I'm not sure it was the best game pitched yesterday.

Zack Greinke also pitched a pretty good game yesterday.
9 innings, 2 hits, 0 runs, 1 walk, 9 K's, 110 pitches.


Greinke allowed 2 less runners to reach base.  He needed 38 less pitches to retire 27 hitters than Lincecum did.  The two hits off Greinke were a loopy line drive to left-center and a bunt

Greinke allowed 20 balls in play.  14 of them were ground balls, 3 were classified as line drives, 1 was an infield fly ball.
Lincecum allowed 14 balls in play.  6 were ground balls, 6 were outfield fly balls, 2 were classified as line drives.


Lincecum pitched a great game.  Greinke probably pitched a bit better.


Lincecum's game will go down in history because Hunter Pence made this catch.


Johnny Vander Meer allowed 12 base runners in his back-to-back no-hitters.
Francisco Liriano walked 6 in his no-hitter
Joe Cowley gave up 6 walks and an earned run in a no-hit game.
AJ Burnett walked 9, hit a batter, threw a wild pitch and allowed 3 steals in his no-hitter.
Edwin Jackson also allowed 9 base runners, but none by hit.

There have been plenty of better pitched games than those above, but they aren't considered historic.

Monday, May 13, 2013

Contract Analysis: Anthony Rizzo

Anthony Rizzo flopped as a Padre in 2011.

He was good as a Cub in 2012.

He's been excellent as a Cub thus far in 2013.

Now he's a multi-millionaire 41 times over.


You probably know about Rizzo's and Jed Hoyer's history.  Hoyer drafted Rizzo when Hoyer with with the Red Sox.  Hoyer traded for Rizzo when Hoyer was with the Padres.  Hoyer traded for Rizzo again when Hoyer was with the Cubs.  Now, they look to united for the near future as Rizzo and Hoyer agreed on a 7 year-$41 million deal (it's more complex than that with a couple of option years and some bonuses.  $41 million is the minimum).

Is it a good deal?  Of course it's a good deal.  If it wasn't then one of the parties wouldn't have signed it.  But who was it good for?

Both parties, most likely.  It's hard to say that a 23 year old assuring himself $41 million is in any way getting a bad deal.  He's set himself up for the rest of his life.

But, how does this deal look in more businesslike terms?

As of right now, Rizzo is on a pace for about 3.5 WAR this season.   Some of that is due to a somewhat unforeseen hot start.  STEAMER and ZiPS projections (available on FanGraphs) project Rizzo for about 2.5 WAR over the rest of the season.  That's a 3.0 WAR pace for an entire season.  Let's say that's Rizzo's real, current, talent level.

Using the same assumptions that I've used with Buster Posey and Justin Verlander, to name just a couple (not that Justin and Buster are dating), what do I end up with for Rizzo?

YEAR      projWAR     SALARY     WARvalue
2013        3.0       $1.0       $15.0
2014        3.5       $3.0       $18.4
2015        4.0       $5.0       $22.1
2016        4.0       $5.0       $23.2
2017        4.5       $7.0       $27.3
2018        4.5       $7.0       $28.7
2019        4.0      $11.0       $26.8
2020        0.0       $2.0        $0.0
TOTAL      27.0      $41.0      $161.0

*NOTE: the $2 million in 2020 is a buyout if the options are declined.
*Cot's Contracts

I get Rizzo producing 27 WAR worth $161 million over the life of the contract and being paid $41 million.  Pretty fine deal for the Cubbies.

A few things are left out of this
First, The Cubs have all of the risk.  If Rizzo never gets another hit, the Cubs are paying him $41 million dollars.
Second, Rizzo wasn't even arbitration eligible yet.  This would have significantly depressed his salary the next few seasons.  Rizzo would have been eligible for arbitration after 2014.  If we use the standard 40/60/80 model (plus a year for super-two eligibility) then the chart looks something like:


YEAR      projWAR     SALARY     WARvalue
2013        3.0       $1.0         $.5
2014        3.5       $3.0        $1.0
2015        4.0       $5.0        $2.0
2016        4.0       $5.0       $13.9
2017        4.5       $7.0       $21.9
2018        4.5       $7.0       $25.8
2019        4.0      $11.0       $26.8
2020        0.0       $2.0        $0.0
TOTAL      27.0      $41.0       $91.9


The Cubs still come out WAY ahead.

The break-even point is a little under 2 WAR per year.  Rizzo would have to be something like 2007-2011 James Loney for the Cubs to come out on the wrong side of this deal.


Anthony Rizzo on FanGraphs


Wednesday, April 3, 2013

2012: Defensive Plays of the Year


9/27 Travis Snider goes Spiderman on Mike Baxter

9/15 Brendan Ryan throws out Andrus from his butt

9/12 Manny Machado fakes out the runner
9/12 Coco Crisp hates Chris Ianetta with the glove and the arm.

9/11/12 Joey Votto cuts of the throw, flips to Phillips
9/9/12 Austin Jackson robs a homerun
9/9/12 Jeff Francoeur throws out Ramirez at 3rd

9/8/12 Mike Trout takes a homerun away to end the game
9/5/12 Cameron Maybe uses his length to rob Kemp

7/24&8/29&31/12 Beltre barehands the bunt and again and again.


8/11/12 Mike Trout robs a homerun and throws for a double play

8/4/12 Mike Trout takes a homerun away
8/4/12 Mark Buehrle gloves the ball to 1st


6/27/12 Mike Trout takes a homerun away

6/12/12 Mike Trout goes deep

http://mlb.mlb.com/video/play.jsp?content_id=23771927
http://mlb.mlb.com/video/play.jsp?content_id=23634015
http://mlb.mlb.com/video/play.jsp?content_id=23631477
http://mlb.mlb.com/video/play.jsp?content_id=22840671


Roy Halladay: What's up? What's down?

Roy Halladay.

?One of? the best pitchers in baseball over the last decade.

Struggled with injuries last season.

Struggled through spring training.

Had one of the crazier stat lines you'll see in his first start of 2013.
3.3 innings, 6 hits, 5 earned runs, 2 home runs, 3 walks, 9 strike outs, 1 loss.

Doesn't look like he pitched well.  All those hits, all those runs, all those home runs, all those walks, all those...strike outs?

Halladay faced 19 hitters.  He struck out almost half of them.  That's typically a recipe for success.

What gives?

I don't pretend to know.

Batted Ball FIP says that Halladay should have given up 3.64 runs per 9 innings giving up those rates of walks, line drives, ground balls and fly balls while getting those strikeouts.


In the 2011 game, Halladay threw strikes on 63% of his pitches.
In today's game, Halladay threw strikes on 57% of his pitches.


Halladay's fastest pitch today was measured at 91.7 MPH and his average fastball was at 89.6 MPH.
On May 5th 2011, also at Turner Field (I used this game to avoid issues with camera angle, radar readings, etc), Halladay's fastest pitch was 94.3 MPH and his average fastball was 93.2 MPH.  Halladay had 46 pitches faster that day than his fastest pitch today.

Braves hitters swung and missed at 13 of 118 pitches in the 2011 game - 11%
Braves hitters swung and missed at 14 of 94 pitches in today's game - 15%

It's odd that a guy could lose that much velocity + get that many more whiffs + get hit around like that.  BABIP and HR/FB are flukey and this is just 1 game and all that jazz...

Another thing, not noticed by me but noticed by lots of people who know more about baseball than me is Hallday's arm slot.

*click to make bigger


The image on the left is from today's game.  The image on the right from the 2011 game.

Notice that the clump of pitches from 2011 is basically bisected by the 6' line.  Meaning that most of Halladay's pitches in 2011 left Halladay's hand about 6' above the ground.  Now, look at the pitches from today's game.  Notice that none of the pitches from today were released from 6' above the ground.

Look at those two clumps again.  The clump from 2011 mostly occur to the right of the -2 foot marker - they were released less than 2' to the right of the center line.  Now the pitches from 2011.  The -2 foot marker bisects the clump a lot more - more pitches were thrown from more than 2 feet from the center line.

Halladay's arm slot appears to be different.  It's lower.


Does this mean anything?

I still don't pretend to know.


Data from May 5 2011
Data from April 3 2013

Tuesday, April 2, 2013

Debut Review: Hyun-Jin Ryu

Hyun-Jin Ryu's first major league appearance was...

...interesting.


He went 6 and a third innings.  That's good.

He gave up 1 earned run.  That's good.

He didn't walk anybody.  That's good.

He struck out 5.  That's good.

He induced 11 groundballs and only 3 fly balls.  That's good.

He gave up 10 hits.  That's not so good.

He only had a single 1-2-3 inning.  That's not so good.

He gave up 2 unearned runs.  Not so good.


The overall numbers on Ryu might look ok:  0 - 1 with a 1.42 ERA, 7.1 K/9 and a infinite K/BB ration.  But we know he didn't pitch that well.  Using Tom Tango's Batted Ball FIP, Ryu would have been expected to give up 3.64 runs per 9 innings.  That's certainly doable.  That's mostly due to the high number of groundballs (11 of 20 batted balls, 55%).  6 line drives (30%) is pretty high.  That'll have to come down.  Too many Giant hitters were squaring him up.  If he keeps getting hit like that, he won't be successful.

Ryu faced 26 hitters and K'd 5 of them.  That's 19%.  The average NL starter (they get to face pitchers while AL pitchers face DH's) K'd 19.2% of the hitters they faced last season.  So Ryu is right about average in that (through 1 game).  The walk rate is great (through 1 game).

Ryu induced 9 swings and misses - 11% of Ryu's pitches induced a swing and miss. Major league average last year was 9%.  Again, Ryu looks about average with his stuff.

Ryu threw 80 pitches.  55 were strikes.  That's a 69% rate.  All major league starters through strikes 63% of the time last season.  Ryu threw a good number of strikes, not a great number.  Not a number that would make one think that Ryu would go the entire season without walking a batter.

According to Brooks Baseball, Ryu threw:
43 4-seam fastballs.  They averaged 89.2 MPH with the fastest coming in at 92.3 MPH
7 2-seam fastaballs.  They averaged 89.5 MPH with the fastest coming in at 91.4 MPH
23 changeups.  They averaged 80.8 MPH.  That's about an 8 MPH difference from his fastball.
7 curveballs.  They averaged 69.9 MPH.

The changeup was tabbed as Ryu's best pitch.  He threw it 23 times and Giant hitters swung and missed 4 times (18%).

Felix Hernandez also has a pretty good changeup.  Hitters have swung on and missed Felix's changeup about 20.5% of the time in his career.

So Ryu's not Felix Hernandez.  I don't think anyone expected that.

Ryu looked like an average to slightly above pitcher with his command and ability to generate swings and misses.  If he can continue getting ground balls that translates into a pretty good pitcher.

If he keeps giving up line drives it's going to be a rough season.


Monday, April 1, 2013

Clayton Kershaw had a good game: 4/1/2013

Clayton Kershaw had a good game.

You can never say that one player "singlehandedly beat" another team.  But...

Kershaw: 9 IP, 4 hits, 0 ER, 0 walks, 7 K's.

and this

A go-ahead solo homerun.


Kershaw had .753 points of WPA today.  His contributions produced about 75% of a win.

How good is that?
If he did that every start this season he'd produce about 25 wins for the Dodgers.

How good is that?
Last season, in the whole season, 247 players produced more than .753 WPA.  Kershaw did it in 9 innings.


2013 Free Agent Team: Contracts

Opening Day.  Time to look to the future.  Major league teams are engaging in a marathon struggle.  7 months, 162 regular season games.


Instead of looking forward at that, I'm going to look back.

In November, the 7th of, I game myself an imaginary $100 million with which to imaginarily lure 25 players to play for my imaginary baseball team in the real year of 2013.

Here's the post and the team that I picked.


Now, the season is upon us.  Al(most all)l of the contracts have been signed and the players are taking the field.  In a over half of a year I'll be able to look back and see how my imaginary team fared.  Before that, though, I should see how well I did at signing players.

Here's a list of the players I wanted to sign along with what I thought they'd sign for.


I don't think I did too bad.  I offered a total of 25 contracts for a total of $98.7 million.  23 of those players actually signed, and for a total of $87.3 million.  A few players I wanted to sign did not sign.  I offered $6 million to Roy Oswalt  and minor league contracts to Kevin Millwood, Jamey Moyer and Dana Eveland.  Millwood retired and nobody else bit on Oswaly, Moyer or Eveland.  If they had signed for what I had offered my total contracts would have to $94 million.  Very close to the $98 million I projected.

My biggest misses were:
Eric Chavez.  I offered 2 years and $10 million.  Chavez signed for 1 year and $3 million.  Pretty big overpay on my part.
My 1 year $6 million offer to Melky Cabrera wouldn't have gotten him.  He took 2 years and $16 from the Blue Jays.
I broke the bank for Nick Swisher at 6 years and $102 million.  He signed for about half of that.  4 years and $56 million.
My 2 year $12 million offer to Jeremy Guthrie was a bit shy.  He took 3 years and $25 million from the Royals.

All-in-all, though, I think I did a good job predicting the contracts and didn't make a fool of myself over or under bidding for players.

Now I just have to wait and see how they perform.

Saturday, March 30, 2013

2013 Season Prediction Post

The season starts tomorrow.  The Season Starts Tomorrow!  THE SEASON STARTS TOMORROW!!!


That makes me happy.

If it doesn't make you happy, then you can just read this because it's basically the Cliff's Notes for the season upcoming.

AL EAST: Yankees 87 wins, Jays 85, Rays 85, Red Sox 84, Orioles 77
AL CENT: Tigers 93, Royals 80, White Sox 79, Indians 78, Twins 71
AL WEST: Angels 90, Rangers 88, A's 85, Mariners 75, Astros 64

NL EAST: Nationals 89, Braves 87, Phillies 85, Mets 71, Marlins 67
NL CENT: Cards 85, Reds 85, Brewers 82, Pirates 78, Cubs 77
NL WEST: Giants 86, DBacks 85, Dodgers 84, Rockies 76, Padres 75

Two 3 team playoffs to decide the Wild Card teams.  Does that make you want to actually watch the season?

AL MVP: Robinson Cano, Mike Trout, Miguel Cabrera
NL MVP: Jason Heyward, Joey Votto, Bryce Harper

AL CY: Justin Verlander, Yu Darvish, King Felix
NL CY: Clayton Kershaw, Matt Cain, Stephen Strasburg/Cliff Lee

AL ROY: Wil Myers, Aaron Hicks, Kevin Gausman
NL ROY: Julio Tehran, Jedd Gyorko, Hyn-Jin Ryu

There you have it.


Contract Analysis: Buster Posey

Add Buster Posey to the list of new MLB multi-millionaires.


Posey and the Giants agreed to a 9-year $167 million extension.

I've been looking at the contracts of some players who have signed extensions recently:
Justin Verlander
Adam Wainwright
Carlos Gomez

How does Posey's deal look?

Projections available on FanGraphs have Posey hitting .383/.503 in 562 PA's and producing 6.25 WAR.

That's good.  That's really good.

Posey's future production is a bit more complex to estimate than other players'.  Posey is a catcher, as such, they decline faster due to the wear-and-tear of the position.  Excellent hitting athletic catchers, of which Posey is, also occasionally quit playing catcher at some point in their career and move to other positions - this prolongs their careers but lessens their value.  As such, I've accelerated Posey's decline to account for either increased potential for breaking down or a move to another positions where his value will be less.

Spoiler


This still turns out well for the Giants

Using the same $5 million per WAR in 2013 with 5% inflation per year as I have with all other players, this is what I get:
YEAR     projWAR            SALARY                 WAR VALUE
2013    6.25      $8 mil         $31 mil
2014    6.5       $12.5 mil      $34 mil 
2015    6.5       $16.5 mil      $36 mil
2016    6.5       $20 mil        $38 mil
2017    5.5       $21.4 mil      $33 mil
2018    4.5       $21.4 mil      $29 mil
2019    4.5       $21.4 mil      $30 mil
2020    4         $21.4 mil      $28 mil
2021    3.5       $24.4 mil      $26 mil
TOTAL  47.8      $167 mil       $285 mil
*Salary source

Given these assumptions, Posey is still expected to provide the Giants with over $100 million in excess value.

Maybe my estimated WAR totals are too high - I didn't want any Giants fans hurling accusations at me.  But Posey is damn good (that should get them off of my back).  Adding the 48 projected WAR to the 13 WAR that Posey has also produced gives him 61 WAR by age 35.

6 catchers since 1900 have produced 60 WAR by age 35
Johnny Bench 75
Ivan Rodriguez 66
Gary Carter 66
Joe Torre 63
Mike Piazza 61
Yogi Berra 60
*source

You've probably heard of those guys and if you're a Giants fan you probably don't mind Posey being mentioned in the same proverbial breath.

Somewhat interestingly, though, is that only one of those players, Piazza with 50 WAR, produced the 48 WAR that I'm projecting Posey for between ages 26 and 35.  The others:
Bench 39
Rodriguez 43
Carter 45
Torre 36
Berra 47
*source

Further only 3 of those pitchers played over 90% of their innings at catcher in their career:
Rodriguez 99.7%
Piazza 96.3%
Carter 91.8%
Bench 81.8%
Berra 76.8%
Torre 41.1%
*source


So, maybe the projection is too high.

It'd have to be astronomically too high for this to be anything other than the Giants signing a phenomenal player to a contract that he's likely to exceed.


Contract Analysis: Justin Verlander

Teams just keep signing their players to extensions.

This time Justin Verlander Summits Money Mountain.


Verlander signed a 7-year $180 million extension with the Tigers.  It's more complex than that, with Verlander's current deal being over-written, a vesting option, some incentives, etc, but that's basically the deal.

Projections available on FanGraphs have Verlander throwing 229 innings with 8.8 K/9, 2.3 BB/9, a 2.96 ERA and 5.5 WAR this season.

As with all the other contracts I've looked at this off-season (Carlos Gomez, Kyle Lohse, Adam Wainwright) I'll assume a $5 million market value for 1 WAR and 5% inflation.  I'll also apply a standard aging decline of .5 WAR per season after Verlander's age 31 season.
YEAR       ProjWAR          SALARY      WAR VALUE
2013         5.5              $20       $27.5
2014         5.5              $20       $28.9 
2015         5.0              $28       $27.6
2016         4.5              $28       $26
2017         4.0              $28       $24.3
2018         3.5              $28       $22.3
2019         3.0              $28       $20.1
TOTAL       31.0             $180      $176.7

Using those parameters I expect Verlander to put up about 31 WAR worth $176.7 million while being paid $180 million.

Verlander is basically being paid what he's expected to produce.  The Tigers didn't get any real discount.  With these types of long-term deal the team usually gets a discount because they assume the risk - the player gets paid regardless of performance.

Per the article I linked to above, anything can happen with Verlander, and nobody knows what will happen.  Deals for pitchers are, generally, more risky than deals for position players.  Verlander has been (one of) the best pitcher on earth over the last few seasons and there's no real reason to expect anything different over the next few seasons (Well, maybe Clayton Kershaw will change that).

Verlander is approaching Tiger icon status.  I can certainly see why Detroit would want to keep him around.  He's on a Hall of Fame trajectory.  There's no reason to think that trajectory is going to significantly change over the next two seasons.  The Tiger are also in win-now mode.  They have Verlander, Cabrera and Prince Fielder in their primes.  They have a some good to very good players backing them up.  The Tigers should be very good for the next 3-5 seasons.   Now they have the best pitcher in baseball locked up for that time frame.


Friday, March 29, 2013

Bad Announcing: Mitch Williams on Relievers

Mitch Williams is ranking his top 10 relief pitchers.

He leaves Sergio Romo off of his list because Romo giving as the reason that Romo doesn't have the ability to strikeout a batter with a runner on 3rd and less than 2 outs.

Moments before he questioned Bill James leaving Jim Johnson off of James' top 10 relievers and Williams ranked Johnson 4th.


Romo has struck out 30.4% of the hitters he's faced in his career.
Johnson has struck out 15.3% of the hitters he's faced in his career.
Romo strikes out hitters nearly twice as frequently as Johnson.  

Wednesday, March 27, 2013

Contract Analysis: Adam Wainwright

The Cardinals and Adam Wainwright agreed on a 5-year $97.5 million extension today.


My immediate reaction was that his was a big overpay by the Cardinals.

Let's look closer.

First, Wainwright is only 31 this season.  I thought he was older.  He did miss the 2011 season after TJ surgery, but picked up right where he left off.

Like I did earlier with Kyle Lohse, I combined the projections available on Fangraphs and came up with this composite projection for 2013:
198 innings, 8.0 K/9, 2.3 BB/9 a 3.33 ERA and 4.9 WAR

Applying the standard aging curve, I'll expect the following WAR totals over the contract:
2013 4.9
2014 4.4
2015 3.9
2016 3.4
2017 2.9
2018 2.4
TOTAL = 21.9 WAR

The exact details of the extension aren't out but it's reported to be $97.5 million over 5 years.  Wainwright is already under contract for $12 million this year.  He'll make a total of $109.5 million before he's a free agent.

Assuming $5 million market value per WAR this year and 5% inflation per season, the total value of Wainwright's production comes out to about $122 million.

Wainwright's expected production slightly exceeds what the Cardinals will pay him.

There is risk for the pitchers.  Some of it already included in the standard aging curve (increased risk of injury and decreased performance).  Is Wainwright more likely to be injured since he's already undergone a TJ surgery?  I don't know.

This isn't a great deal for the Cardinals, but it's not a bad one either.


Contract Analysis: Kyle Lohse

Kyle Lohse finally signed a contract - with the Milwaukee Brewers.

Was it a good deal?

Projections available on FanGraphs have Lohse pitching 185 innings this year with 5.9 K/9, 2.0 BB/9, 3.83 ERA and 2.9 WAR.

Given that Lohse is 34 we can apply the standard aging decline of 0.5 WAR per season.  Doing so we get:
2013 2.9 WAR
2014 2.4 WAR
2015 1.9 WAR
TOTAL 7.2 WAR

Lohse will be paid $33 million over that time, however due to the deferment of some of the money the actual present value of his contract is $31.95 million.
*source

It's generally accepted that the current value of 1 WAR is $5 million.  If we apply 5% inflation then the total value of the WAR that Lohse is expected to provide is:
2013 2.9 WAR * $5 = $14.5 
2014 2.4 WAR * ($5*1.05) = $12.6
2015 1.9 WAR *($5*1.05*1.05) = $10.5
TOTAL $37.6 million

Lohse's expected production outweighs his cost by about $5.5 million.

There's also the loss of the draft pic.  According to this research, the average value of the #17 pick is around $5 million - almost the exact amount of the difference between Lohse's cost and expected production.

Purely on cost, this looks like a reasonable deal.


FanGraphs recently released their Positional Power Rankings for 2013.  Those rankings had the Brewers #25 in starting pitching with 10.4 total WAR.  Inserting Lohse into the equation gives us:
Gallardo 199 IP 3.7 WAR
Estrada 187 IP 2.9 WAR
Lohse 185 IP 2.9 WAR
Fiers 136 IP 1.7 WAR
Narveson 122 IP 1.1 WAR
Peralta 40 IP 0.3 WAR
Rogers 25 IP 0.2 WAR
TOTAL 894 IP 12. 8 WAR

That's an increase in 2.4 WAR for the rotation, which would bump the Brewers up to 18th in starting pitching WAR.

Adding all the position player WAR and pitcher WAR together gives us some idea how teams will finish the season.

Using FanGraph's numbers the expected WAR for each AL Central team is:
Reds 44.7
Cardinals 42.8
Brewers 39.9
Pirates 39
Cubs 38.9

The acquisition of Lohse moves the Brewers from last in the division to 3rd.  More importantly, less than 5 WAR behind the Reds for first in the division.  5 WAR is close enough that random variation gives the Brewers a reasonable chance of winning the division.

My own projections have the division as:
Cardinals 42 WAR
Reds 40.5 WAR
Brewers 38.3 WAR
Pirates 79.8 WAR
Cubs 29.3 WAR

This move isn't a world beater for the Brewers.  They paid market value for a decent pitcher that will push them that much closer to competing for the division or one of the wild card spots.